


WINGX Global Market Tracker:
FAA ground stop pulls global business jet activity down 5.1% in Week 46
Global business jet activity fell by 5.1% year-on-year in Week 46 (9–15 November), with just under 76,800 departures against 80,903 in the same week last year.
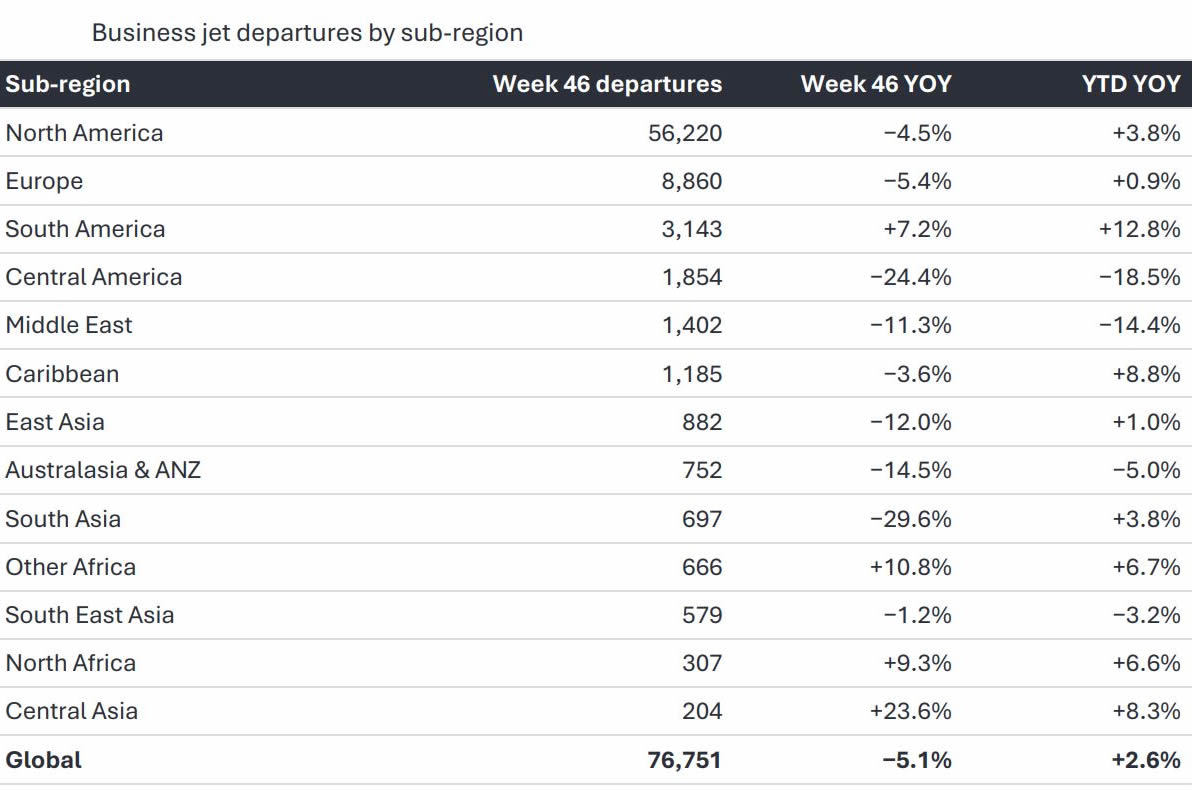
The FAA’s nationwide ground stop on the afternoon of Friday 13 November halted US departures for more than four hours at the busiest point of the week. Friday departures in the US fell by about a quarter, and only part of the shortfall was recovered over the weekend. Over the last four weeks activity is down 3.2%, while the year to date remains 2.6% ahead at just over 3.55 million departures. North America fell 4.5% and Europe 5.4%; Central America was again the weakest sub-region at −24.4%, while South America (+7.2%) and Africa (+10.3%) grew.
JETNET data show 1,786 business jets for sale, 6.9% of the in-service fleet of 25,778 jets, up 15 on the previous week. 35 new listings came to market during the week, down from 60 in Week.
What Drove the Week
Contribution to global YOY change by sub-region (pp), Week 46.
click image to enlarge
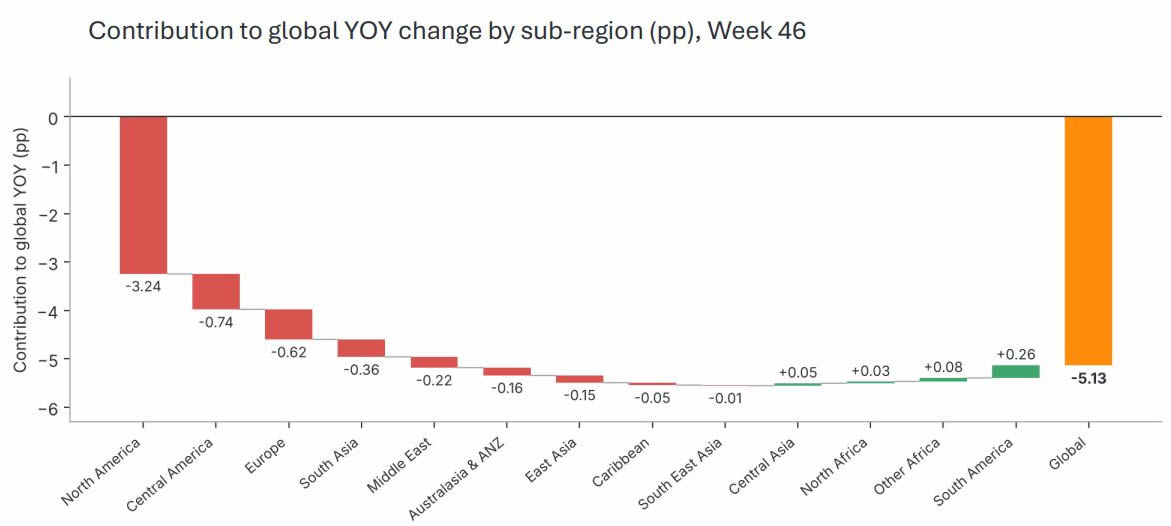
North America took 3.24 points off global growth, almost two-thirds of the total decline. Central America subtracted 0.74 points, Europe 0.62 points, South Asia 0.36 points and the Middle East 0.22 points, with smaller drags from Australasia & ANZ and East Asia. South America added 0.26 points and Africa 0.11 points.
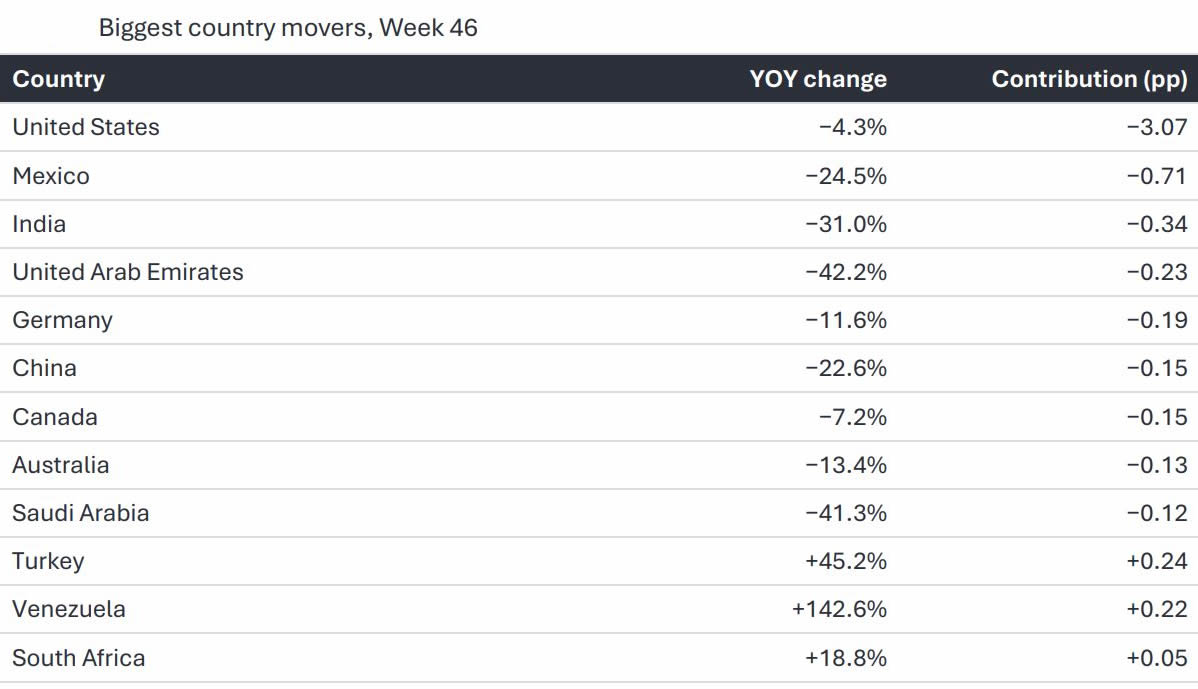
The United States alone accounted for 3.07 points, with departures down 4.3%. Mexico (−24.5%, 0.71 points) was the next-largest drag, followed by India (−31.0%), the UAE (−42.2%) and Germany (−11.6%). On the positive side, Turkey (+45.2%) added 0.24 points as world leaders gathered in Antalya for COP31, and Venezuela (+142.6%) added 0.22 points.
Biggest country movers, Week 46.
click image to enlarge
Trend Context
Global YOY change by week, Weeks 35–46.
click image to enlarge
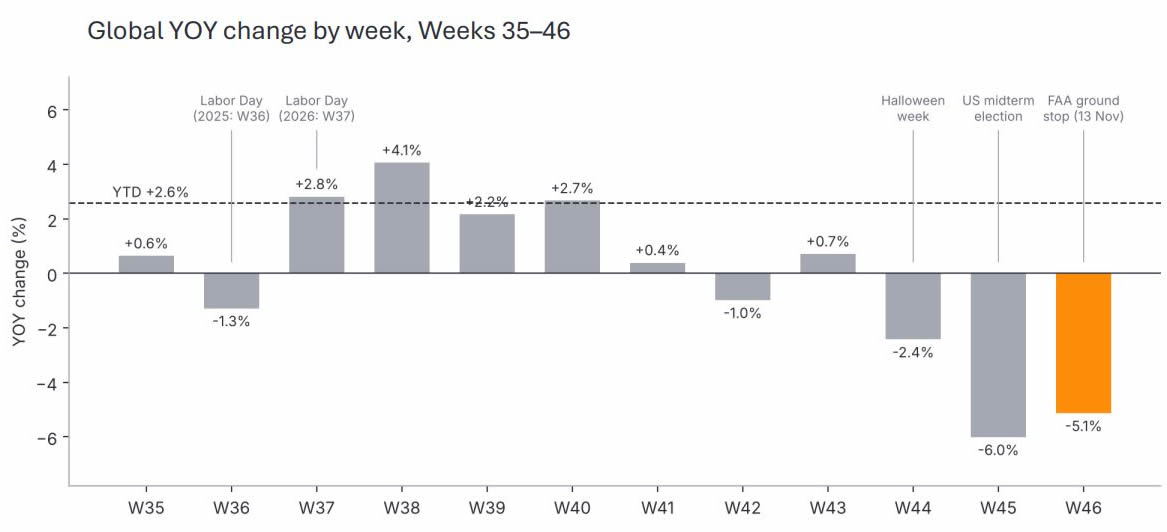
Week 46 was the second consecutive week with a decline of more than 5%. From late August to mid-October, global activity ran between −1.3% and +4.1% year-on-year, with the Labor Day timing shift moving traffic between Weeks 36 and 37. Halloween week (Week 44) was down 2.4%, the US midterm election week (Week 45) 6.0%, and Week 46 5.1%. The last three weeks have each been affected by a calendar or one-off event, but the underlying US trend has also softened: US departures from Monday to Thursday, before the ground stop, were already 4.2% below last year.
Regional Performance Analysis in Week 46
Business jet departures by sub-region.
click image to enlarge
North America
North America fell 4.5% to just over 56,200 departures. The US fell 4.3%, holding a 97.2% share of the region and 71.2% of global activity, and Canada fell 7.2%. Among the larger US states, Florida (−8.1%), Georgia (−12.9%) and New York (−18.9%) were weakest, with California down 5.0% and Texas almost flat (−0.8%). Indiana (+17.0%), Louisiana (+14.3%),
Massachusetts (+12.0%) and Nevada (+9.3%) grew. North America remains 3.8% ahead year to date, with the US up 4.0% and Canada down 2.8%.
Europe
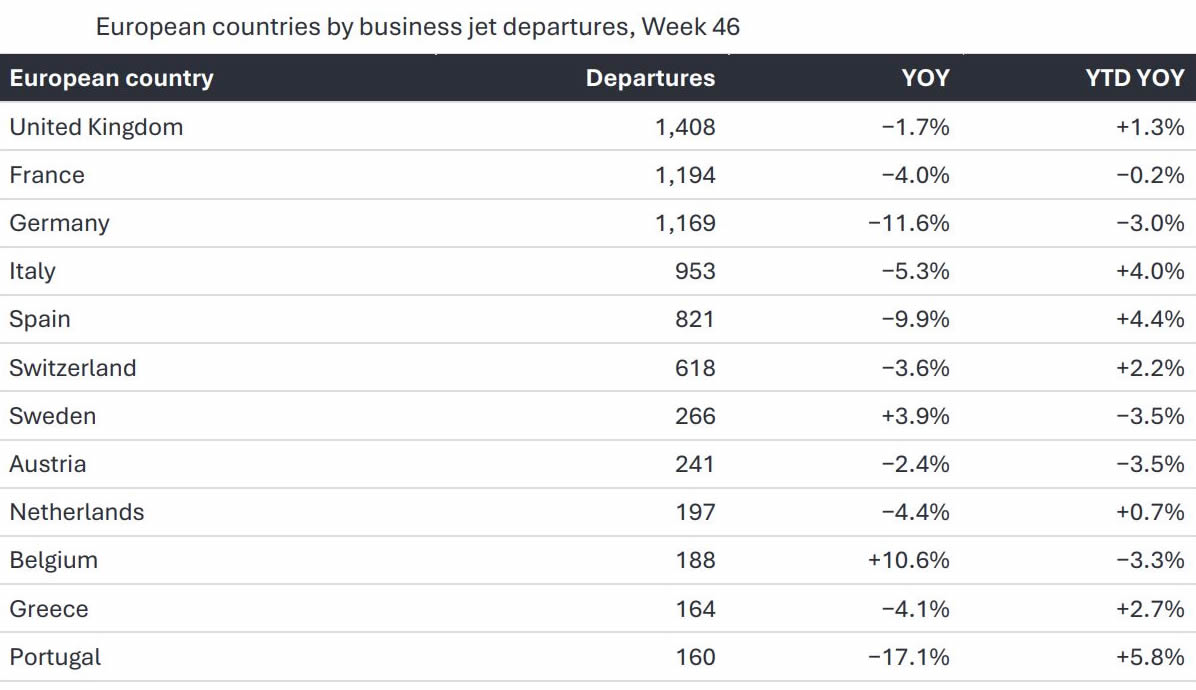
Europe fell 5.4% to just under 8,900 departures and is 0.9% ahead year to date. Germany fell 11.6%, Spain 9.9%, Italy 5.3% and France 4.0%, while the United Kingdom (−1.7%) and Switzerland (−3.6%) were steadier. Belgium (+10.6%) and Sweden (+3.9%) grew. US-bound departures from Europe were also held during Friday evening’s ground stop.
European countries by business jet departures, Week 46.
click image to enlarge
Rest of the World
South America rose 7.2%, led by Venezuela, where departures more than doubled on the back of locally registered light jets; Brazil slipped 1.7%. The Caribbean fell 3.6%, although the Dominican Republic grew 27.9%. Asia fell 13.9%: India was down 31.0%, with departures by corporate flight departments falling by more than half as the week followed Diwali (8 November this year, against 20 October last year), and China fell 22.6%. Africa grew 10.3%, with South Africa up 18.8% and Nigeria 20.3%, while Australasia & ANZ fell 14.5%. The Middle East fell 11.3%: the UAE (−42.2%) and Saudi Arabia (−41.3%) declined across both charter and managed fleets, extending a weak year for the Gulf. Turkey moved the other way, rising 45.2% as Antalya, host of COP31 and its World Leaders’ Summit on 11–12 November, saw 168 business jet departures against barely two dozen a year ago.
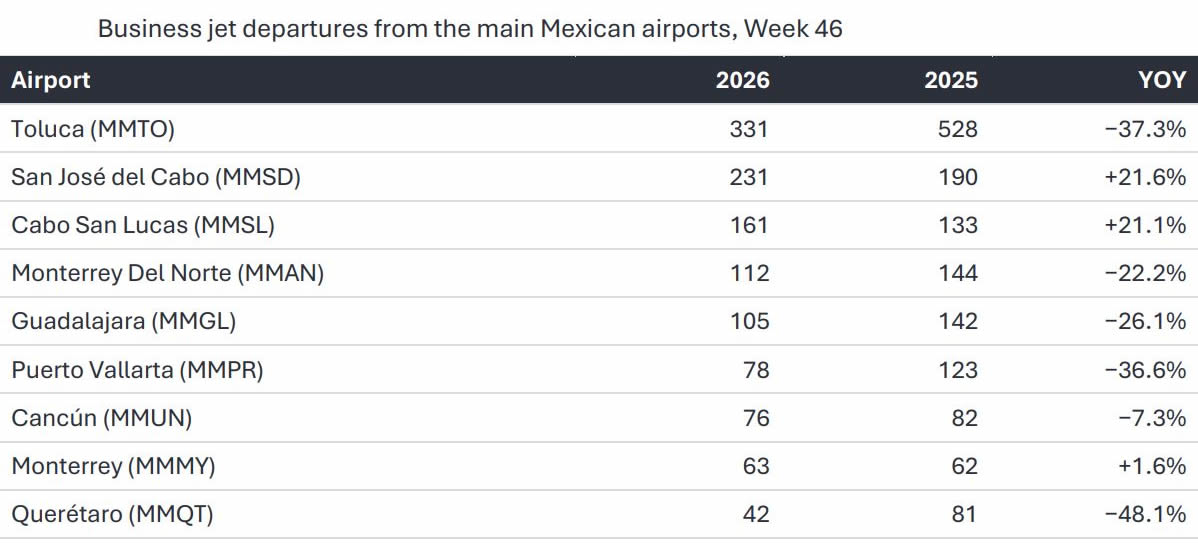
Mexico remains the weakest major market. Departures fell 24.5% to around 1,780, and the country is down 19.5% year to date. Domestic flying has been between 29% and 49% below last year in every week since August, so Week 46 continues an established trend rather than a oneweek dip. The decline is again entirely domestic: domestic departures fell 42.0%, while international departures rose 8.5%. Domestic flying fell 54.6% on US-registered aircraft and 34.5% on Mexican-registered aircraft.
Toluca, the main hub for Mexico City, handled 331 departures (−37.3%), and its share of Mexican departures fell from 22.4% to 18.6%. Business centres were weakest, with Querétaro (−48.1%), Guadalajara (−26.1%) and Monterrey Del Norte (−22.2%) all down, along with Puerto Vallarta (−36.6%). Los Cabos bucked the trend, with San José del Cabo up 21.6% and Cabo San Lucas up 21.1% as the winter season began.
Business jet departures from the main Mexican airports, Week 46.
click image to enlarge
Mover of the Week: The FAA Ground Stop
On Friday 13 November, the FAA issued a nationwide ground stop at 15:54 Eastern Time after a telecommunications failure affected most of its Air Route Traffic Control Centers. Departures resumed after 20:15 Eastern Time, more than four hours later. US business jet departures that Friday fell to 6,792, 25.6% below the same day last year, against declines of 2.9% to 6.7% on Monday to Thursday. Between 14:00 and 19:00 local time, departures were 1,284, against 2,958 on the previous Friday.
US business jet departures by day, Week 46 2026 against 2025.
click image to enlarge
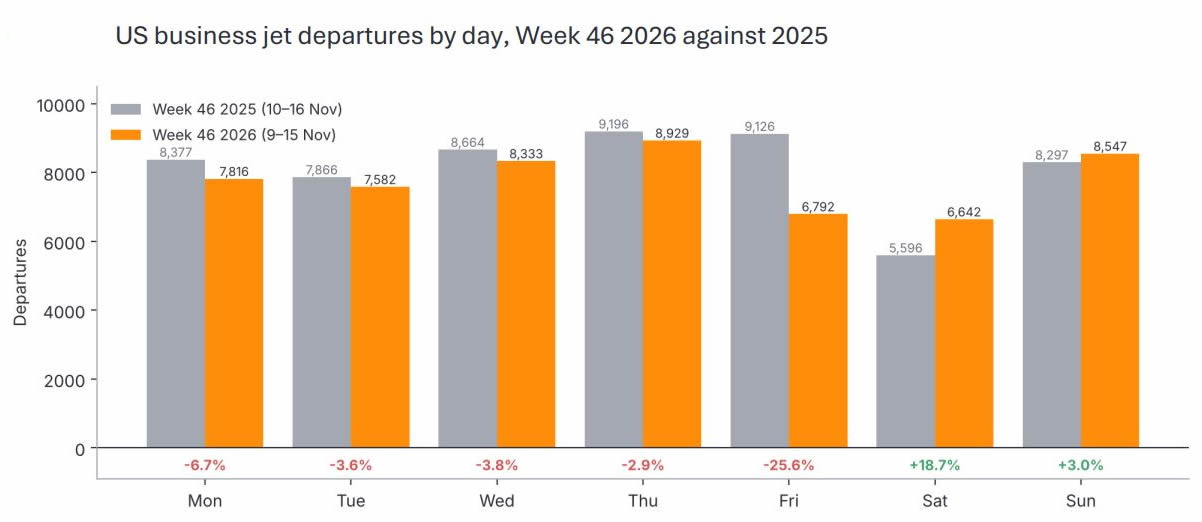
Some of the lost flying moved into the weekend. Saturday departures were 18.7% above last year at 6,642, and Sunday was up 3.0%. Measured against the Monday-to-Thursday trend, the ground stop cost about 1,950 departures on Friday, of which roughly two-thirds were recovered on Saturday. The net loss of around 670 departures took about 0.8 points off global growth. Excluding the net effect of the ground stop, North America would have fallen by about 3.3% year-on-year.
Who Is Flying
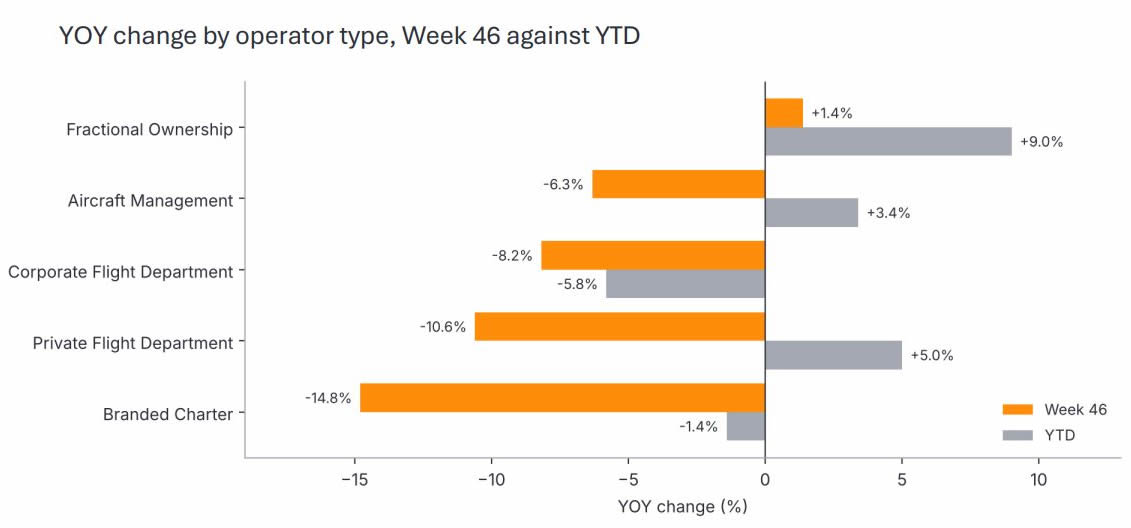
Fractional ownership was the only major operator type to grow last week, with departures up 1.4%, a return to growth after a flat Week 45; it remains the fastest-growing segment year to date (+9.0%). Branded charter fell 14.8%, its seventh consecutive weekly decline and the steepest of the run, and is now down 1.4% year to date. Corporate flight departments fell 8.2%, an eighth consecutive weekly decline, and are down 5.8% year to date. Private flight departments fell 10.6% and aircraft management 6.3%.
YOY change by operator type, Week 46 against YTD.
click image to enlarge
Fleet Lens
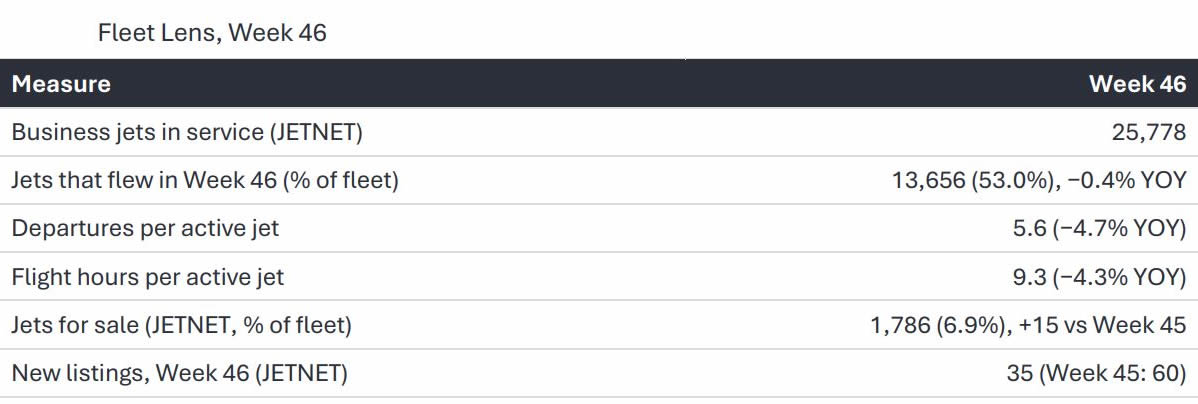
13,656 business jets flew at least once in Week 46, 53.0% of JETNET’s in-service fleet of 25,778 and only 0.4% fewer than in the same week last year. The active fleet held up, but each jet flew less: 5.6 departures (−4.7%) and 9.3 flight hours (−4.3%) per active jet, consistent with flights lost to Friday’s ground stop rather than aircraft leaving the market. Year to date, 23,155 airframes have been active, 2.5% more than last year. On the supply side, 1,786 jets are listed for sale, 6.9% of the fleet and 15 more than a week earlier, with 35 new listings during the week, down from 60 in Week 45.
Fleet Lens, Week 46.
click image to enlarge
Conclusion
Nick Koscinski, WINGX Analyst, comments, “Friday’s ground stop took a real bite out of the week, and most of the 5.1% decline sits in the US. About two-thirds of the lost Friday flying came back on Saturday, but the US was already running behind last year before the stop.
"Fractional fleets were the only operator type to grow last week, while branded charter fell for a seventh week running. On the supply side, JETNET shows 1,786 jets for sale, 6.9% of the fleet, with new listings slowing.”
Note: Figures cover business jets including VIP/bizliner aircraft. All figures exclude turboprops.
This bulletin is produced by WINGX, part of the JETNET Group. The JETNET Group is an independent organisation with no commercial affiliation with BlueSky News. All references to products, services, and events in this bulletin are editorial in nature and have not been paid for or sponsored by any third party.



“Friday’s ground stop took a real bite out of the week, and most of the 5.1% decline sits in the US. About two-thirds of the lost Friday flying came back on Saturday, but the US was already running behind last year before the stop.
"Fractional fleets were the only operator type to grow last week, while branded charter fell for a seventh week running. On the supply side, JETNET shows 1,786 jets for sale, 6.9% of the fleet, with new listings slowing.”
Nick Koscinski
WINGX Analyst.
WINGX GmbH
Lilienstraße 11
20095 Hamburg
Germany.
+49 40 23 96 85 05
BlueSky Business Aviation News | 19th November 2026 | Issue #867

| © BlueSky Business Aviation News Ltd 2008-2026 |