


WINGX Global Market Tracker:
Mid-Terms contribute to big dip in global bizjet activity
Global business jet activity fell by 6.0% year-on-year in Week 45 (2–8 November), with just over 76,300 departures against 81,238 in the same week last year.
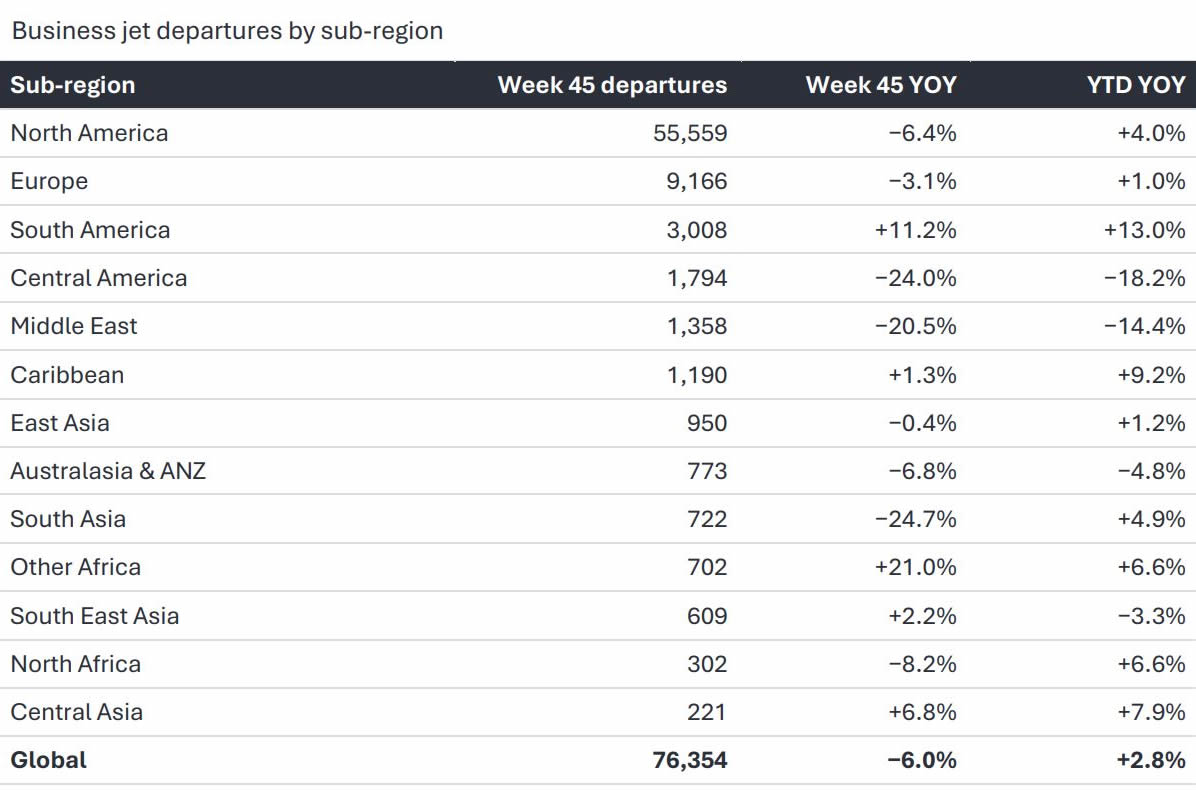
The decline coincided with the US midterm elections on 3 November. In the US, election weeks have consistently run below the autumn trend, and last year’s comparison week had no federal election. Over the last four weeks, activity is down 2.2%, while the year-to-date trend remains 2.8% ahead at almost 3.47 million departures. North America fell 6.4% and Europe 3.1%, and Central America was the weakest sub-region at −24.0%. South America (+11.2%) and Africa (+10.5%) were the strongest.
JETNET data shows 1,771 business jets for sale, 6.9% of the in-service fleet of 25,775 jets. 60 new listings came to market during the week, down from 67 in Week 44.
What Drove the Week
Contribution to global YOY change by sub-region (pp), Week 45.
click image to enlarge
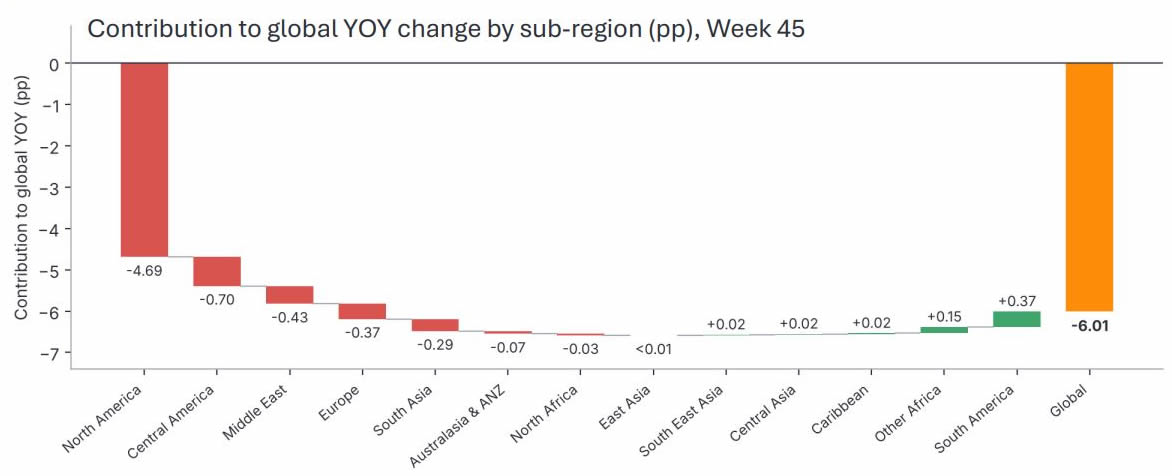
North America took 4.69 points off global growth, almost four-fifths of the total decline. Central America subtracted 0.70 points, the Middle East 0.43 points, Europe 0.37 points and South Asia 0.29 points. South America added 0.37 points and Other Africa 0.15 points, with smaller gains from the Caribbean, Central Asia and South East Asia.
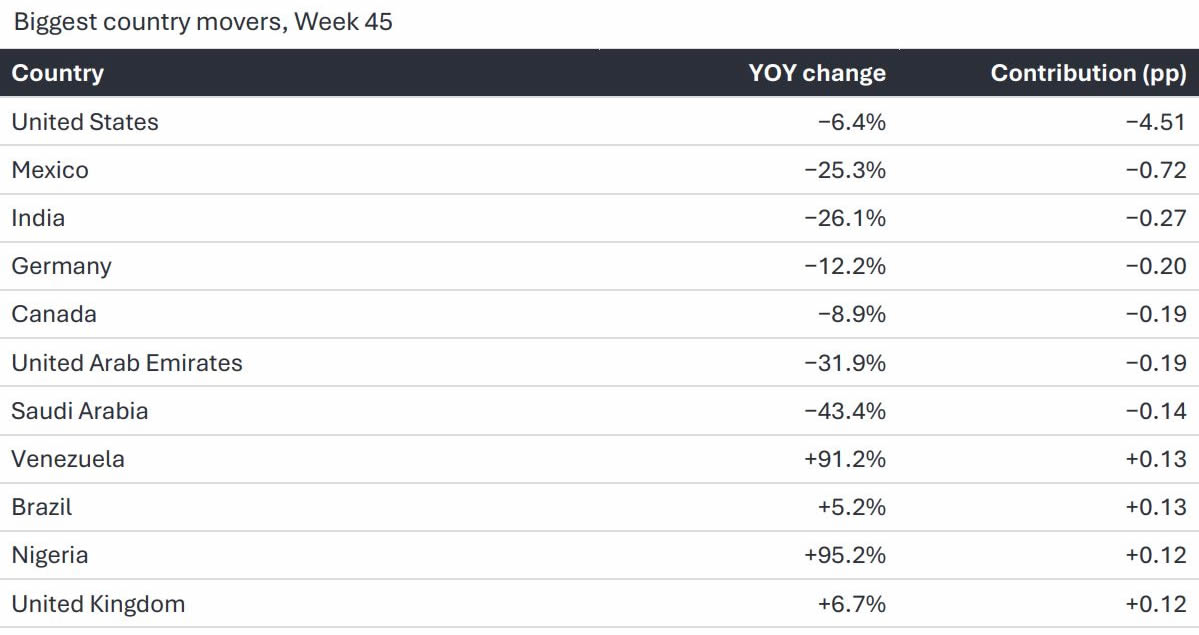
The United States alone accounted for 4.51 points, with departures down 6.4%. Mexico (−25.3%, 0.72 points) was the next-largest drag, followed by India (−26.1%), Germany (−12.2%), Canada (−8.9%), the UAE (−31.9%) and Saudi Arabia (−43.4%). On the positive side, Venezuela (+91.2%), Brazil (+5.2%), Nigeria (+95.2%) and the United Kingdom (+6.7%) each added just over a tenth of a point.
Biggest country movers, Week 45.
click image to enlarge
Trend Context
Global YOY change by week through five market phases, Week 1 2024 – Week 45 2026.
click image to enlarge
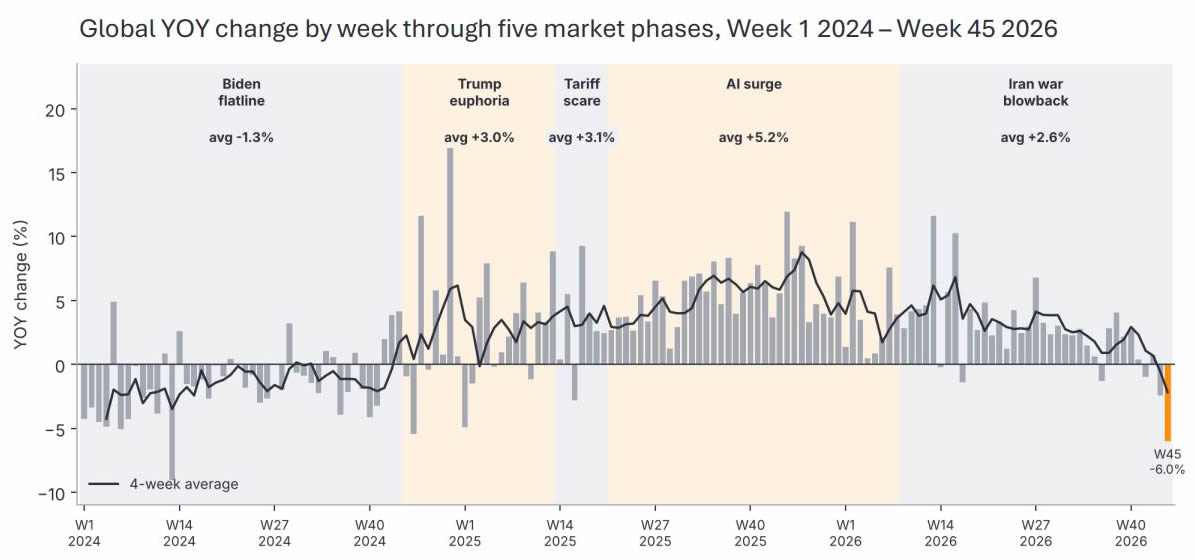
Over a longer horizon, business jet demand has moved through five distinct phases. Through most of 2024, ahead of the US presidential election, activity was flat to slightly down, averaging −1.3% year-on-year. Growth picked up after the November 2024 election, averaging +3.0% to the end of March 2025. The US tariff announcements of 2 April 2025 did not dent flying: the seven weeks to the US–China tariff truce in mid-May still averaged +3.1%. The strongest phase followed, with growth averaging +5.2% from late May 2025 to February 2026. Since the US–Israeli strikes on Iran on 28 February 2026, which closed Gulf airspace for several days, growth has slowed to an average of +2.6%. The Gulf has been hit hardest, with the UAE down 33.5% and Saudi Arabia 23.6% year to date, and the four-week global average has now turned negative for the first time since January 2025.
Global YOY change by week, Weeks 34–45.
click image to enlarge
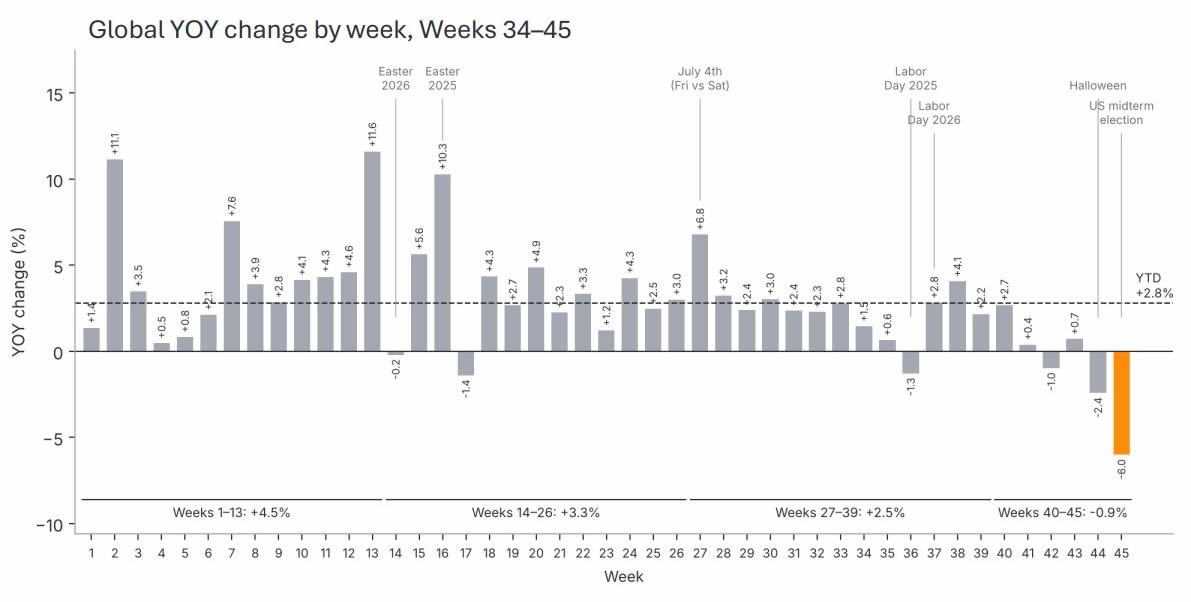
Week 45 was the weakest week of 2026 so far. Global activity has grown year-on-year in 39 of the year’s 45 weeks, but the pace has cooled steadily. Weeks 1–13 averaged +4.5%, Weeks 14–26 +3.3% and Weeks 27–39 +2.5%, and the six weeks since have been 0.9% below last year. The two strongest weeks, Week 2 (+11.1%) and Week 13 (+11.6%), were both measured against soft weeks in 2025.
Most of the other swings reflect holiday timing. Easter fell in Week 14 this year (5 April), against Week 16 last year (20 April). That produced a flat Week 14 (−0.2%) and a jump in Week 16 (+10.3%), followed by a soft Week 17 (−1.4%) against last year’s post-Easter rebound. July 4th fell on a Friday in 2025 and a Saturday in 2026, lifting Week 27 (+6.8%). The later Labor Day (7 September, against 1 September) moved traffic from Week 36 (−1.3%) into Week 37. Halloween week (Week 44) was down 2.4%, and Week 45 deepened the decline to 6.0%, well below the year-to-date rate of +2.8%.
Is election week always quieter?
US election-date week against the October baseline, 2008–2026.
click image to enlarge
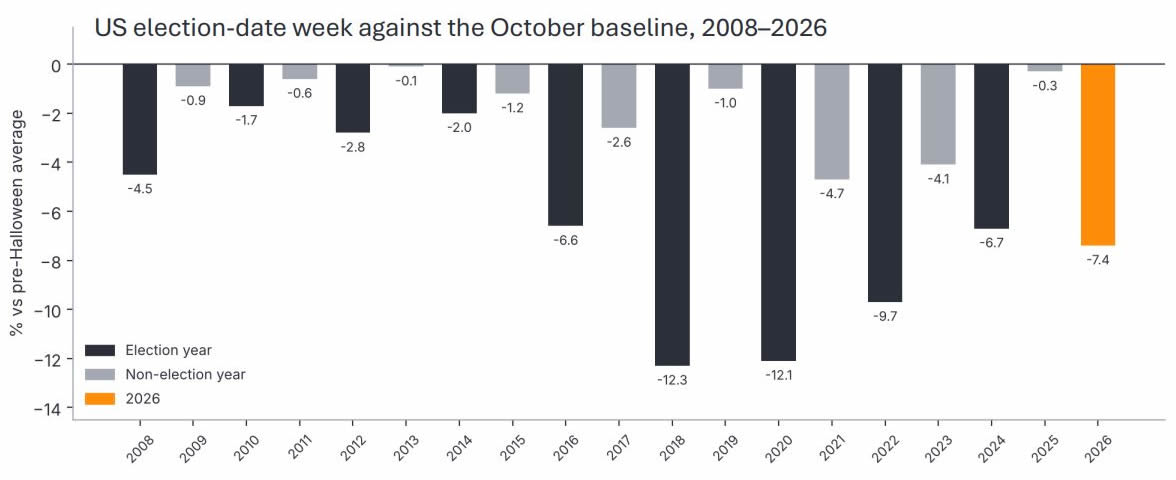
To test whether election week is a genuine calendar effect, we compared US business jet departures in the week of the November election date with the average of the three weeks before Halloween week, for every year since 2008. In election years, the week ran on average 6.5% below that October baseline, and every federal election week since 2016 has been between 6.6% and 12.3% lower. In non-election years, the same week averaged just −1.7% and was never weaker than −4.7%. This year’s US reading of −7.4% sits squarely in the election-year range, while last year’s comparison week was only 0.3% below its baseline. The election calendar therefore likely explains most of the US decline in Week 45.
Regional Performance Analysis in Week 45
Business jet departures by sub-region.
click image to enlarge
North America
North America fell 6.4% to just over 55,500 departures. The US was also down 6.4%, holding a 97.0% share of the region and 70.6% of global activity, and Canada fell 8.9%. Among the larger US states, California (−11.9%), New York (−12.9%), Tennessee (−11.1%) and Illinois (−10.6%) fell further than Florida (−5.3%) and Texas (−5.6%). The District of Columbia (−21.4%) and Virginia (−16.7%) were also weak, with departures from Washington Dulles down 21.2%. Indiana (+23.7%) and Mississippi (+21.2%) bucked the trend. Teterboro grew 3.0%, but Westchester (−18.5%) and Las Vegas (−14.0%) fell. North America remains 4.0% ahead year to date, with the US up 4.2% and Canada down 2.7%.
Europe
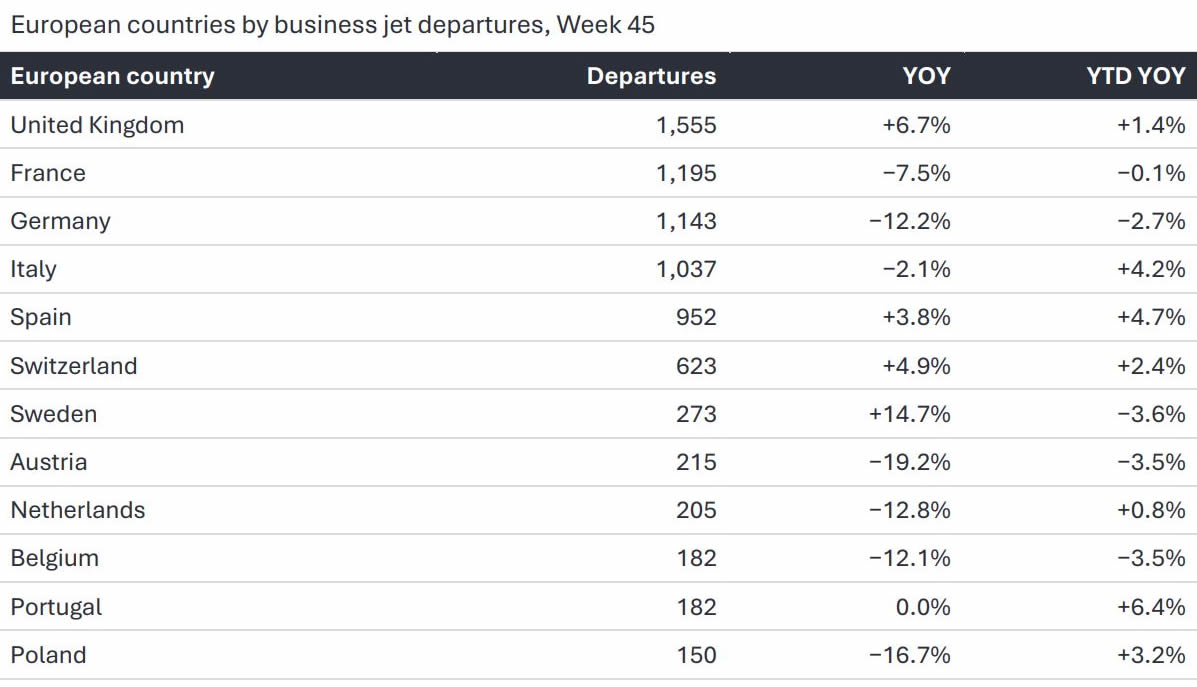
Europe fell 3.1% to just under 9,200 departures and is 1.0% ahead year to date. The United Kingdom grew 6.7%, Spain 3.8%, Switzerland 4.9% and Sweden 14.7%. Germany fell 12.2%, France 7.5% and Austria 19.2%, and Italy slipped 2.1%.
European countries by business jet departures, Week 45.
click image to enlarge
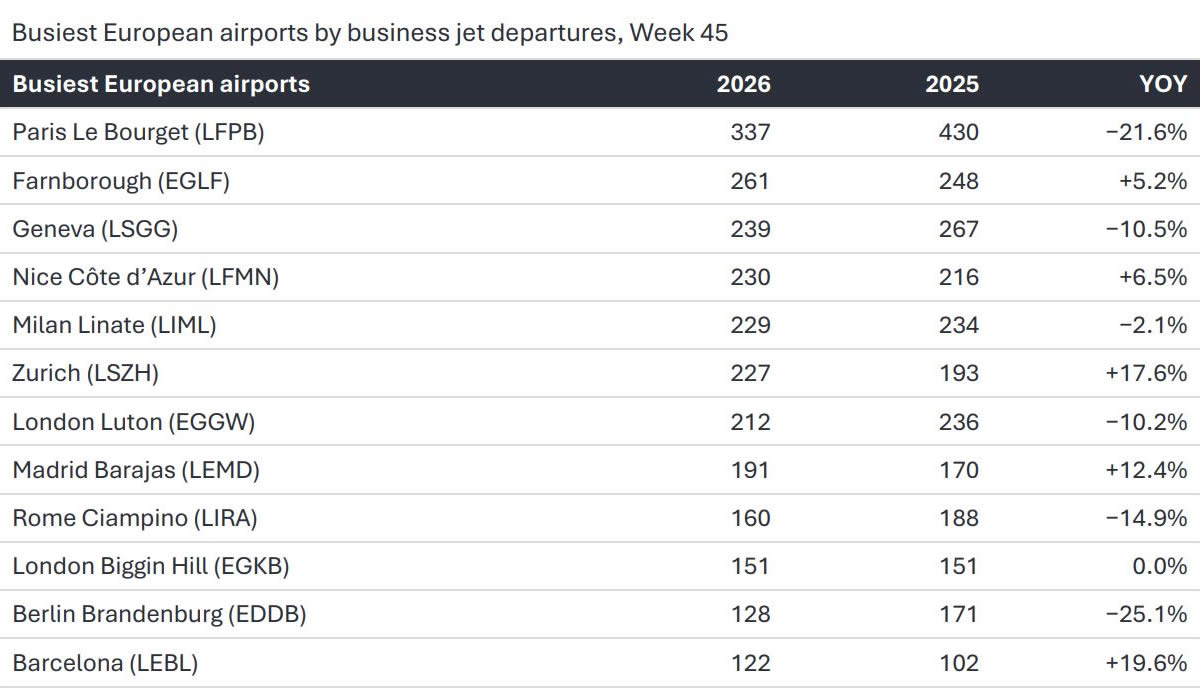
Paris Le Bourget remained Europe’s busiest business jet airport with 337 departures, although 21.6% below last year, as the riots are seemingly playing a role on Paris’ bizjet activity. Farnborough (+5.2%), Nice (+6.5%), Zurich (+17.6%), Madrid (+12.4%) and Barcelona (+19.6%) all grew. Geneva (−10.5%), Luton (−10.2%), Rome Ciampino (−14.9%) and Berlin (−25.1%) were weaker, and Biggin Hill was flat.
Busiest European airports by business jet departures, Week 45.
click image to enlarge
Rest of the World
South America rose 11.2%, led by Brazil (+5.2%) and a near-doubling in Venezuela (+91.2%), where the growth came from locally registered light jets. The Caribbean edged up 1.3%. Asia fell 7.9%: India was down 26.1%, with departures by corporate flight departments falling by more than half as the week led into Diwali (8 November this year, against 20 October last year). East Asia was flat (−0.4%), South East Asia rose 2.2% and Central Asia 6.8%. Africa grew 10.5%, with Nigeria almost doubling (+95.2%), while Australasia & ANZ fell 6.8%. In the Middle East (−20.5%), departures from the Gulf states fell 38.9%, extending a weak year for the UAE (−33.5% year to date) and Saudi Arabia (−23.6%). Excluding the Gulf, the Middle East grew 3.1%, helped by Turkey (+8.6%).
Mexico remains the weakest major market. Departures fell 25.3% to around 1,730, and the country is down 19.3% year to date. Central America has been between 22% and 31% below last year in every week since mid-September, so Week 45 continues an established trend rather than a one-week dip. The decline is entirely domestic. Domestic departures fell 39.0%, while international departures were almost flat (−1.3%). Domestic flying fell 55% on US-registered aircraft and 31% on Mexican-registered aircraft.
Mexico departures by flight type and registration, Week 45.
click image to enlarge
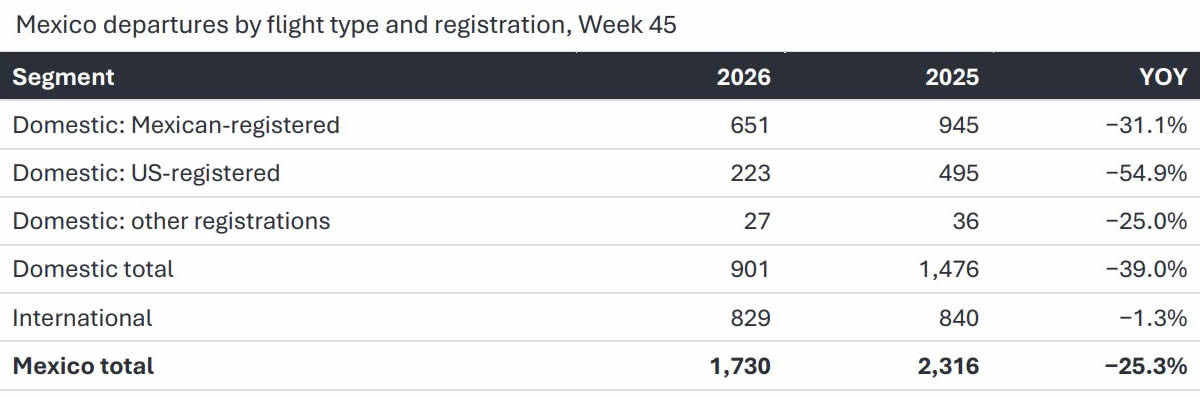
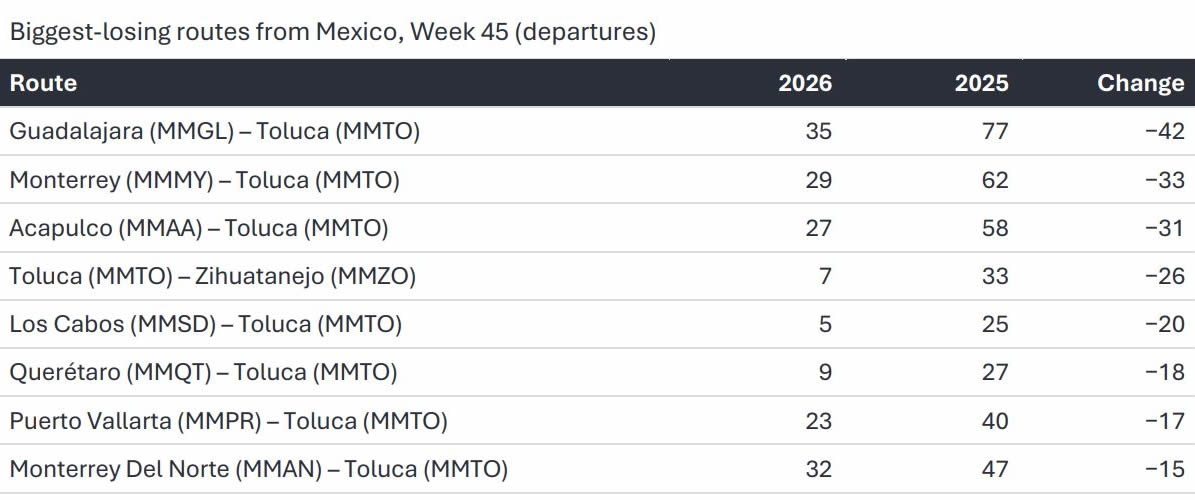
The number of operators flying domestically fell from 313 to 251. This points to losses across a long tail of small private and management operators, led by Aerolíneas Ejecutivas (down 62 departures). Fractional operators bucked the trend, with NetJets (+35) and Flexjet (+26) both growing, as did Servicios Aéreos Across (+68). Toluca handled 352 departures (−26.5%), keeping its share of Mexican departures at around 20%. The biggest losses were on Toluca’s
trunk routes to Guadalajara, Monterrey and Acapulco, and on resort links to Zihuatanejo and Los Cabos. The weakness came even though the Mexico City Grand Prix fell on 1 November this year, against 26 October in 2025, which likely put some post-race departures into Week 45.
Biggest-losing routes from Mexico, Week 45 (departures).
click image to enlarge
Fleet Lens
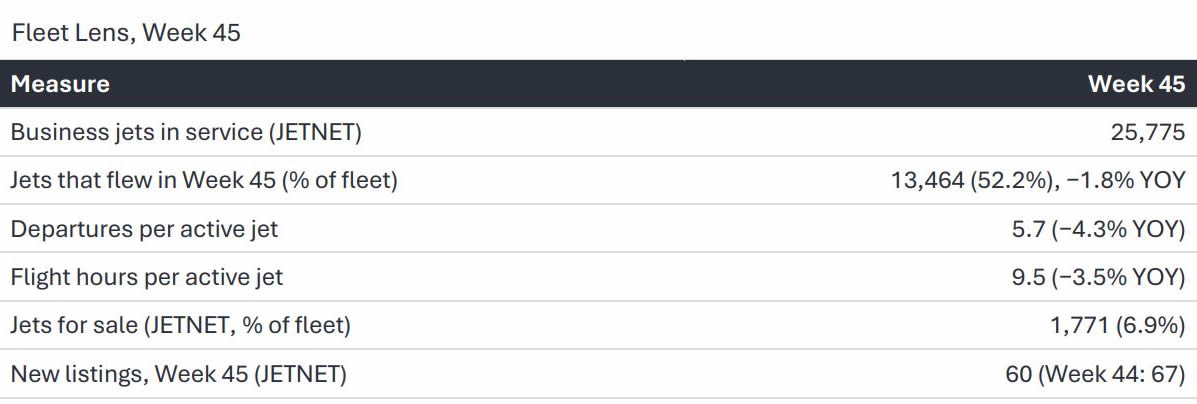
13,464 business jets flew at least once in Week 45. That is 52.2% of JETNET’s in-service fleet of 25,775, and 1.8% fewer than in the same week last year. Each active jet flew 5.7 departures (−4.3%) and 9.5 flight hours (−3.5%), so the election-week slowdown showed up in utilisation as well as in the size of the active fleet. On the supply side, 1,771 jets are listed for sale, 6.9% of the fleet, with 60 new listings during the week, down from 67 in Week 44.
Fleet Lens, Week 45.
click image to enlarge
Looking Ahead to Week 46
Last year’s Week 46 (10–16 November 2025) covered the final days of the 43-day US government shutdown, which ended on 12 November 2025. With no election in the way and federal funding in place until 11 December, US activity should move back towards its October trend.
Conclusion
Nick Koscinski, WINGX Analyst, comments, “Week 45 was always going to look soft due to the mid-terms, and the 6.0% drop is mostly the election calendar at work: US election weeks have run well below the October trend in every cycle since 2016.
"Fractional fleets held flat even so, while corporate flight departments and branded charter carried the decline. On the supply side, JETNET shows 1,771 jets for sale, 6.9% of the fleet, as new listings also slowed during the week.”
Note: Figures cover business jets including VIP/bizliner aircraft. All figures exclude turboprops.
This bulletin is produced by WINGX, part of the JETNET Group. The JETNET Group is an independent organisation with no commercial affiliation with BlueSky News. All references to products, services, and events in this bulletin are editorial in nature and have not been paid for or sponsored by any third party.



“Week 45 was always going to look soft due to the mid-terms, and the 6.0% drop is mostly the election calendar at work: US election weeks have run well below the October trend in every cycle since 2016.
"Fractional fleets held flat even so, while corporate flight departments and branded charter carried the decline. On the supply side, JETNET shows 1,771 jets for sale, 6.9% of the fleet, as new listings also slowed during the week.”
Nick Koscinski
WINGX Analyst.
WINGX GmbH
Lilienstraße 11
20095 Hamburg
Germany.
+49 40 23 96 85 05
BlueSky Business Aviation News | 12th November 2026 | Issue #866

| © BlueSky Business Aviation News Ltd 2008-2026 |