


WINGX Global Market Tracker:
Halloween week and Riyadh’s FII postponement pulls global business jet activity down in Week 44
Global bizjet activity fell 2.4% year-on-year in Week 44 (26 Oct-1 Nov), with just over 74,000 departures operated globally.
Halloween fell in Week 44 in both years, and while Halloween week is always quieter than a typical week in the US, this year’s dip was a little deeper than usual, but it could be attributed to Halloween falling on different days of the week. The Middle East was also hit by the postponement of Riyadh’s Future Investment Initiative (FII), which inflated last year’s comparison.
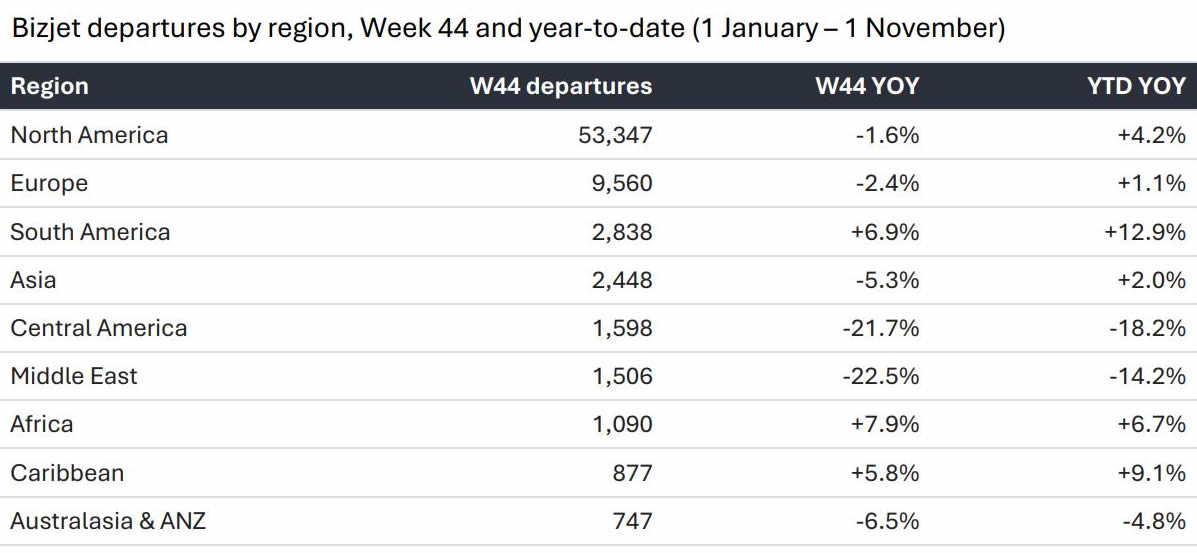
The four-week trend has turned slightly negative at -0.5%, while the year-to-date figure stands at +3.0% ahead of last year through 1 November. North America slipped 1.6% and Europe 2.4%, while Central America (-21.7%) and the Middle East (-22.5%) remained the weakest regions last week.
On the fleet side, JETNET data shows 1,784 business jets listed for sale, 6.9% of the in-service fleet and up for a fourth consecutive week.
What Drove the Week
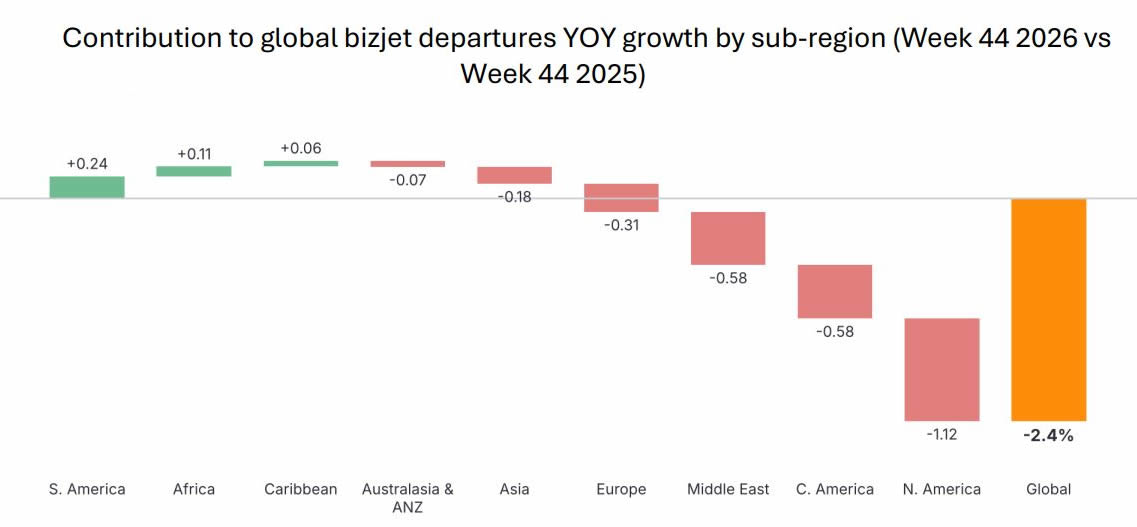
The chart below breaks global growth down by sub-region. North America took 1.12 points off global growth, while Central America and the Middle East each subtracted a further 0.58 points. South America (+0.24 points), Africa (+0.11 points) and the Caribbean (+0.06 points) were the only sub-regions to grow.
Contribution to global bizjet departures YOY growth by sub-region (Week 44 2026 vs Week 44 2025).
click image to enlarge
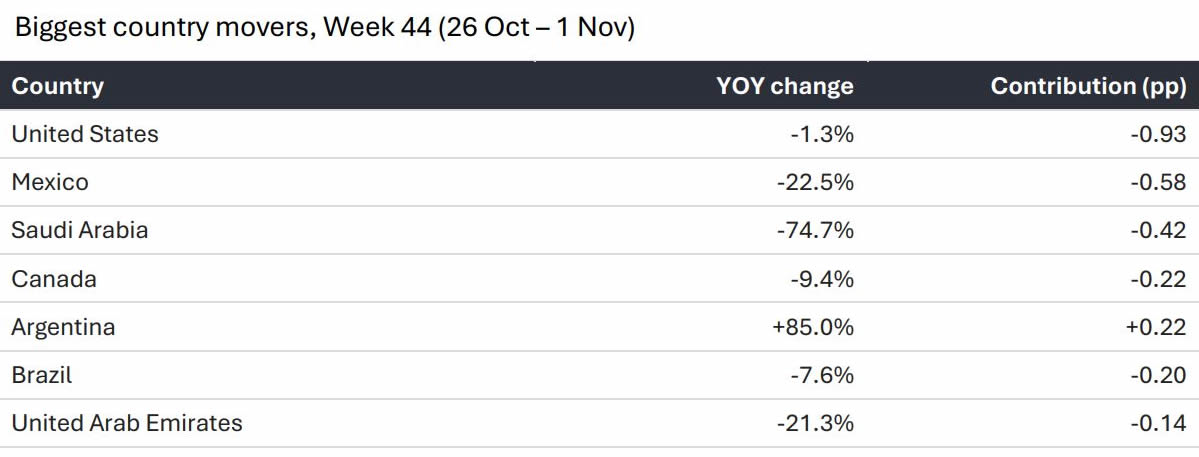
On a top country basis last week, the United States, down 1.3%, was the largest drag on global growth, followed by Mexico (-22.5%) and Saudi Arabia (-74.7%). Argentina (+85%) was the largest contributor to growth.
Biggest country movers, Week 44 (26 Oct-1 Nov).
click image to enlarge
Trend Context
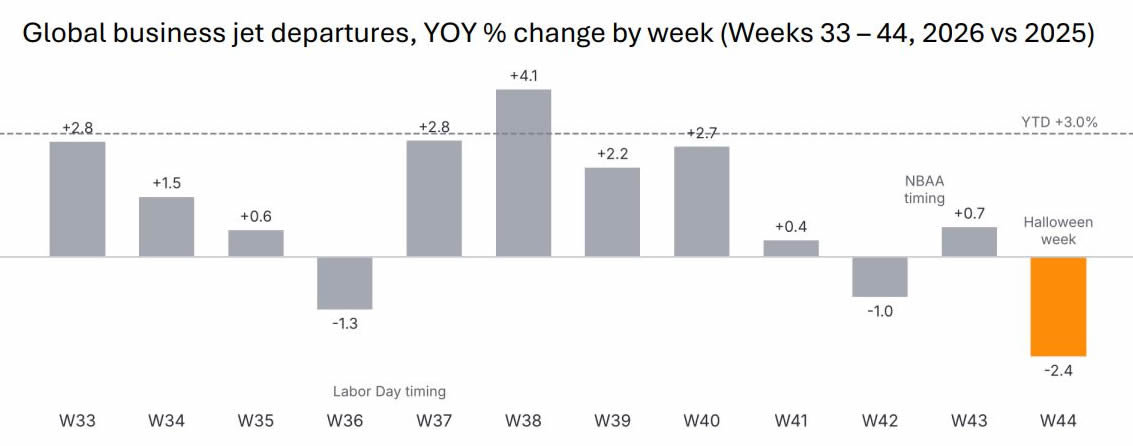
The chart below puts Week 44 in context. Weekly year-on-year growth held largely in a 2–4% range through the summer and early autumn, but has slowed to around zero over the last four weeks as 2026 is compared against the start of last year’s strong fourth quarter. Week 44 was the weakest week since early September.
Global business jet departures, YOY % change by week (Weeks 33-44, 2026 vs 2025).
click image to enlarge
Is Halloween week always quieter?
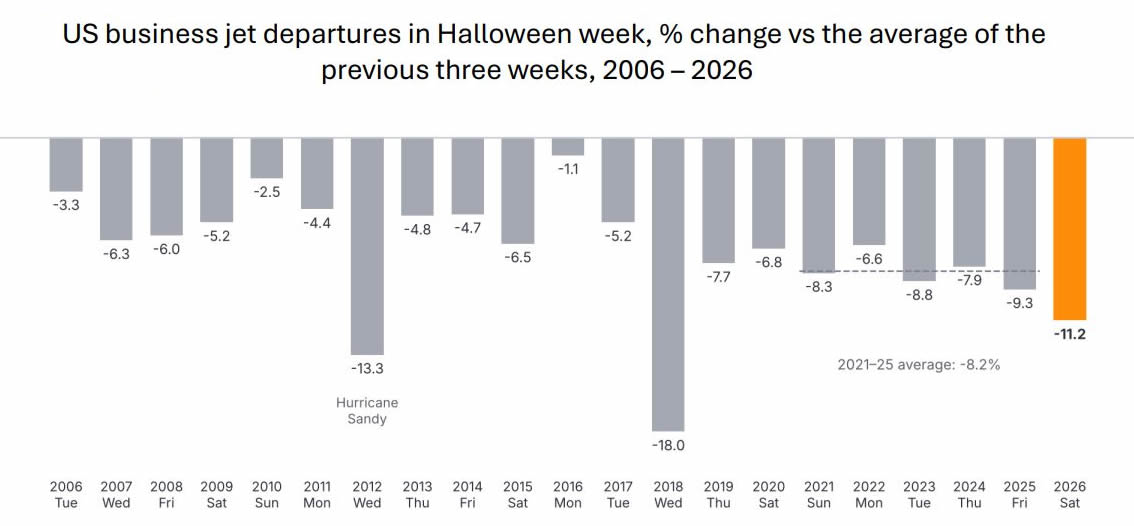
To see whether Halloween week is always weaker than a typical week, Chart 3 compares US business jet departures in the week containing Halloween with the average of the three weeks before it, for every year since 2006. Halloween week was lower in all 20 years from 2006 to 2025, whichever day Halloween fell on. The dip has deepened in recent years, averaging 8.2% from 2021 to 2025, and last year’s was 9.3%.
This year’s Halloween week was 11.2% below the previous three weeks, the deepest since 2018 and around 2–3 points weaker than the recent norm.
US business jet departures in Halloween week, % change vs the average of the previous three weeks, 2006 – 2026.
click image to enlarge
Regional Performance Analysis in Week 44
Bizjet departures by region, Week 44 and year-to-date (1 January-1 November).
click image to enlarge
North America
The North American market slipped 1.6% year-on-year last week, with just over 53,300 departures. The United States accounted for roughly 97% of North American flights (and around 70% of all global departures) with 51,699 flights, down 1.3%, while Canada fell 9.4%.
As Chart 3 above shows, Halloween week was a little quieter than usual in the US this year. Across the full week, New Jersey (+13.4%), Georgia (+8.1%) and Texas (+4.8%) grew, and Florida was flat, while California (-14.0%), Missouri (-12.6%) and Tennessee (-6.4%) declined. On a year-to-date basis, North America remains the anchor of global growth, up 4.2%.
Europe
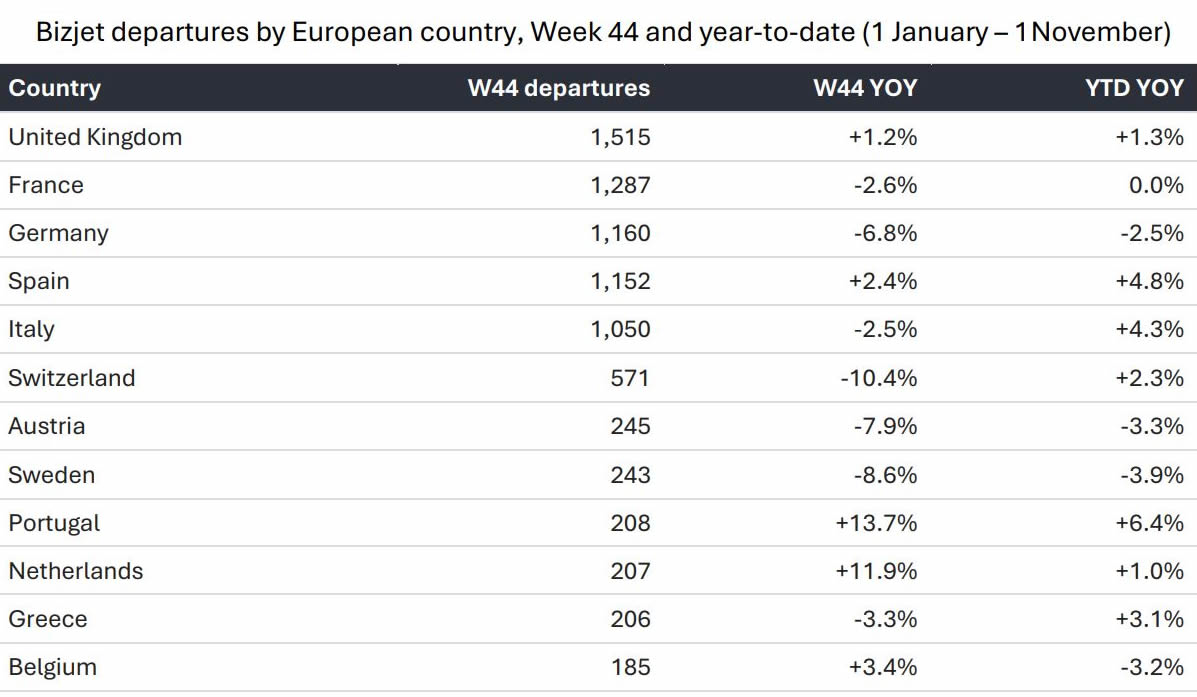
European business jet traffic eased 2.4% year-on-year in Week 44 with just over 9,550 flights, and its year-to-date trend sits at +1.1%. Among the largest markets, the UK (+1.2%) and Spain (+2.4%) grew, while Germany fell 6.8%, France 2.6% and Italy 2.5%. Switzerland was down 10.4%, while Portugal (+13.7%) and the Netherlands (+11.9%) grew strongly.
Bizjet departures by European country, Week 44 and year-to-date (1 January-1 November).
click image to enlarge
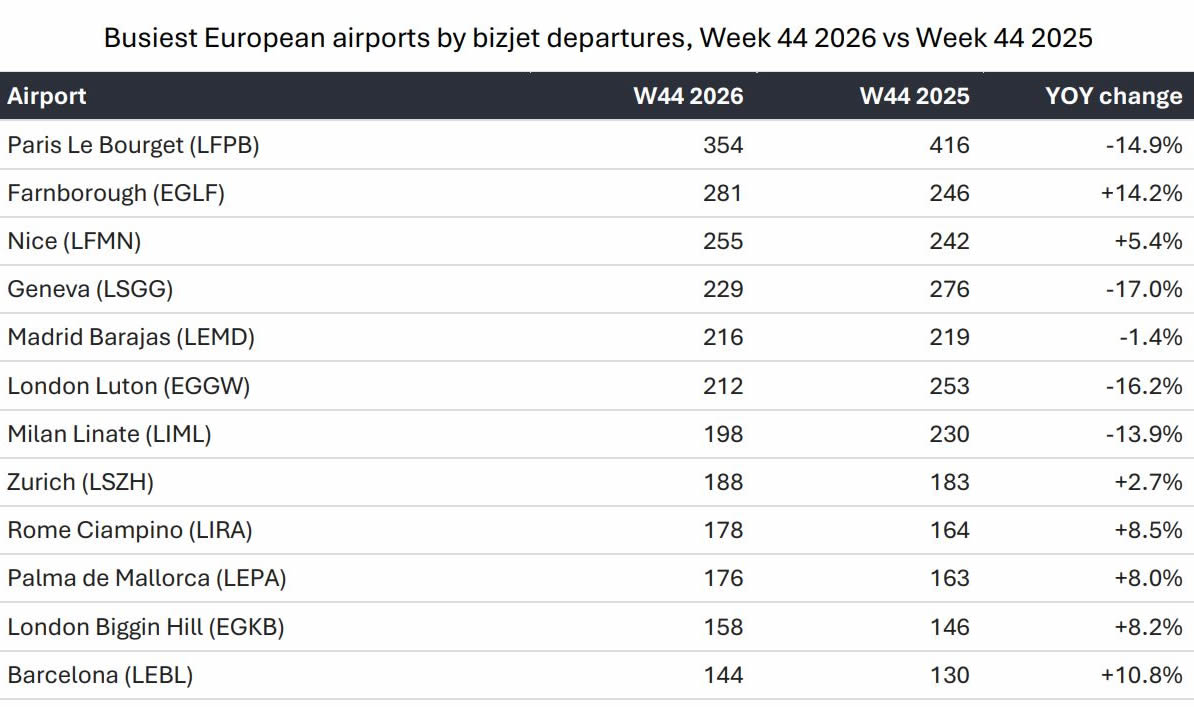
At airport level, Paris Le Bourget remained Europe’s busiest business aviation airport but fell 14.9% year-on-year, potentially the result of continued riots. Geneva (-17.0%), London Luton (-16.2%) and Milan Linate (-13.9%) also declined, while Farnborough (+14.2%), Barcelona (+10.8%) and Amsterdam Schiphol (+38.0%) grew.
Busiest European airports by bizjet departures, Week 44 2026 vs Week 44 2025.
click image to enlarge
Rest of the World
Outside Europe and North America, Africa (+7.9%), South America (+6.9%) and the Caribbean (+5.8%) grew. South America’s gain came from Argentina (+85%) and Venezuela (+83%), offsetting a 7.6% decline in Brazil. Asia fell 5.3% and Australasia & ANZ 6.5%.
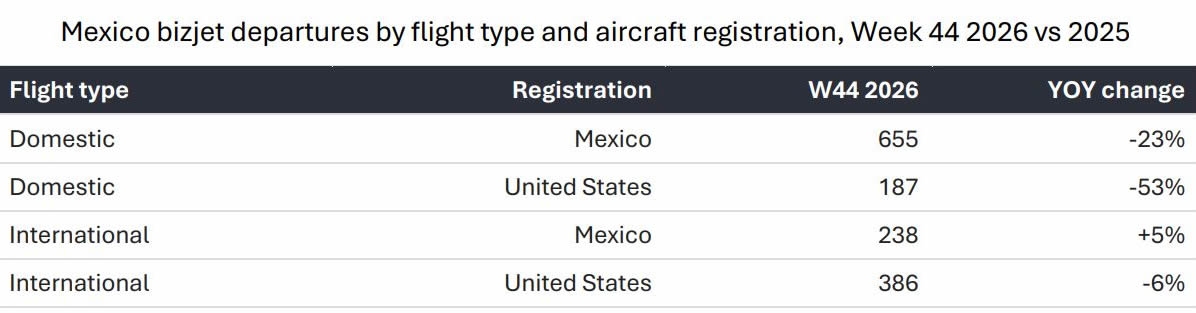
Mexico, which is the main contributor to the decline in Central America, fell 22.5%, and as in previous weeks the decline was in domestic flying rather than cross-border traffic. Flights within Mexico fell 33% year-on-year, while international departures were down only 2%. Domestic flights by US-registered jets more than halved, and Mexican-registered domestic flights fell 23%. Toluca, the country’s busiest business aviation airport, fell 22%.
Mexico bizjet departures by flight type and aircraft registration, Week 44 2026 vs 2025.
click image to enlarge
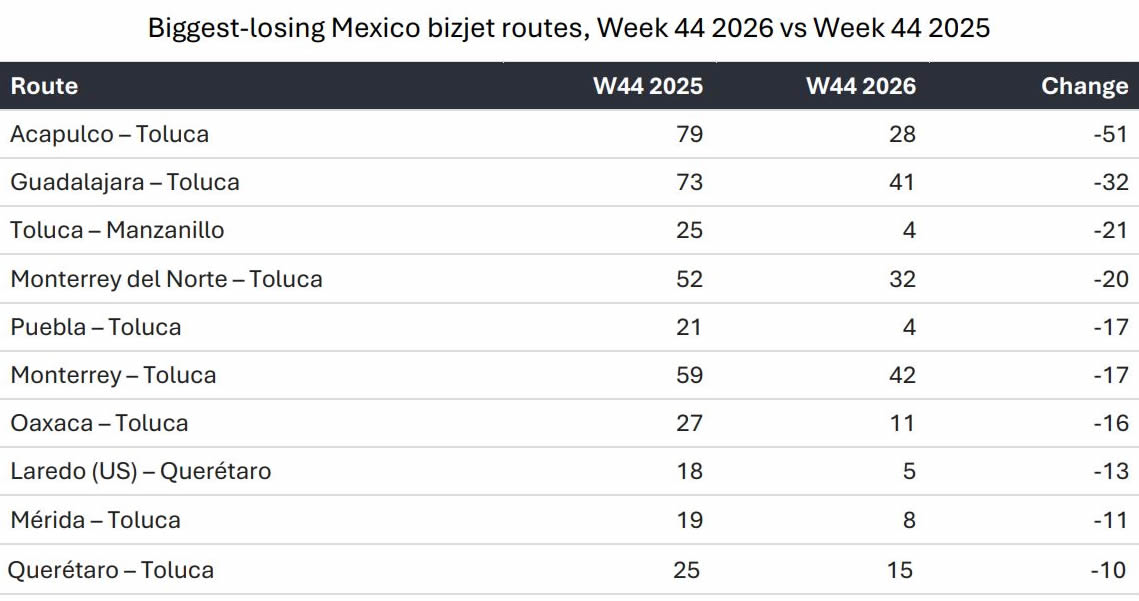
At route level, the decline was centered on Toluca. Routes into and out of Toluca lost 208 flights (-25%), almost half of Mexico’s total decline, and nine of the ten biggest-losing routes connected Toluca with regional cities and beach destinations. Acapulco – Toluca fell from 79 to 28 flights, followed by Guadalajara – Toluca (-32), Toluca – Manzanillo (-21) and Monterrey del Norte – Toluca (-20). Domestic flying away from Toluca fell by a similar 33%, while flights
between Mexico and the US were broadly flat. Cross-border routes into Los Cabos were among the few to grow, with Van Nuys – Los Cabos up from 3 to 14 flights.
Part of the Acapulco drop is calendar timing. Last year, the Day of the Dead holiday (1–2 November) fell on a weekend inside Week 44, and Acapulco – Toluca flights doubled from a normal 36–42 a week. This year 2 November fell on a Monday, moving the return flights into Week 45. Domestic flying in Mexico was also down 37% the week before, so the holiday shift explains only a small part of the decline.
Biggest-losing Mexico bizjet routes, Week 44 2026 vs Week 44 2025.
click image to enlarge
Mover of the Week: FII postponement in Riyadh
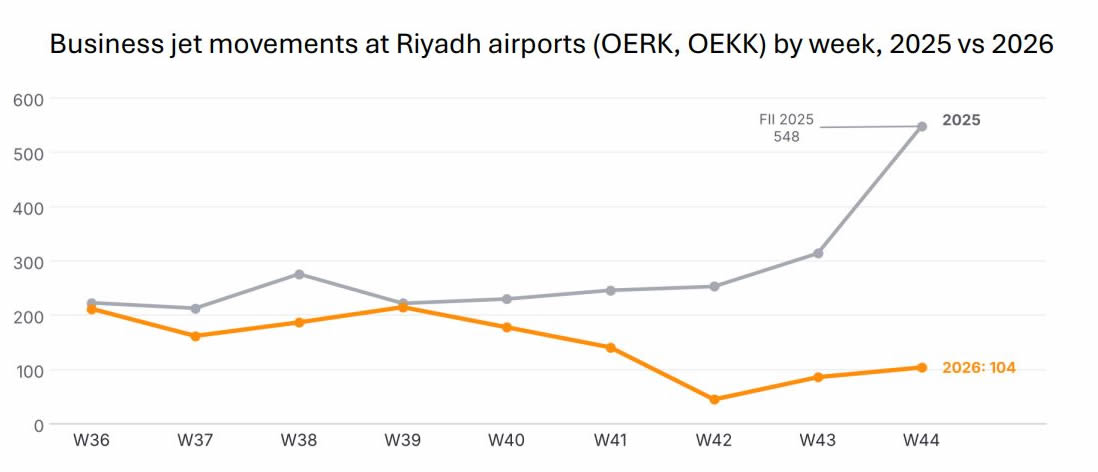
The Middle East fell 22.5% in Week 44, and Saudi Arabia alone took 0.42 points off global growth, with departures down 75%. Last year, Week 44 coincided with the Future Investment Initiative in Riyadh, which drew a surge of business jet traffic: movements at Riyadh’s airports reached 548 that week, around double the usual level. This year’s edition, planned for 26–29 October, was postponed to 2027, and Riyadh movements were just 104.
Business jet movements at Riyadh airports (OERK, OEKK) by week, 2025 vs 2026.
click image to enlarge
Gulf departures as a whole fell 44%; excluding Saudi Arabia, the decline was 27%, broadly in line with recent weeks. The UAE fell 21.3%.
Who Is Flying
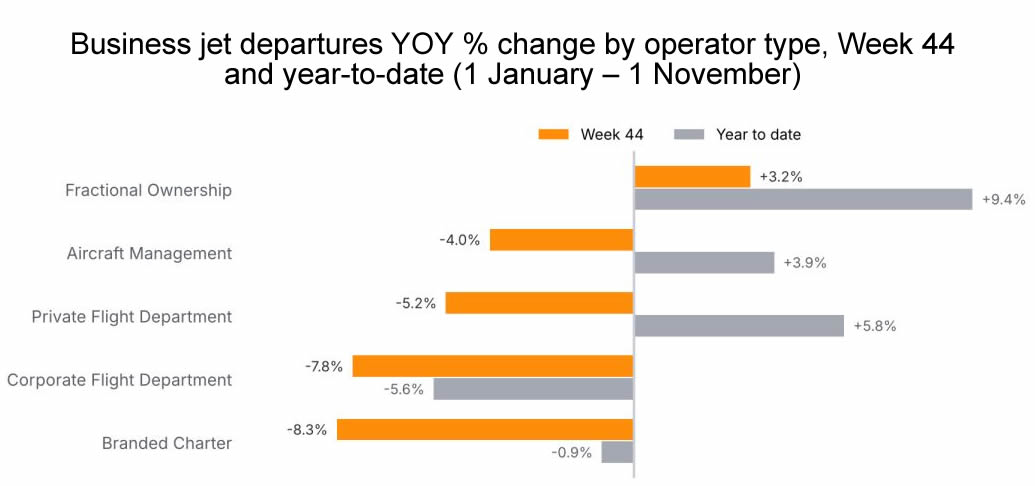
Fractional operators were again the only major operator type to grow, up 3.2% in Week 44. Aircraft management fell 4.0%, private flight departments 5.2% and corporate flight departments 7.8%. Branded charter fell 8.3%, its fourth consecutive weekly decline, with North America down 8.3% and Europe 5.7%. Year-to-date, fractional activity remains the strongest segment, up 9.4%, followed by private flight departments (+5.8%) and aircraft management (+3.9%), while corporate flight departments are down 5.6% and branded charter 0.9%.
Business jet departures YOY % change by operator type, Week 44 and year-to-date (1 January-1 November).
click image to enlarge
Fleet Lens
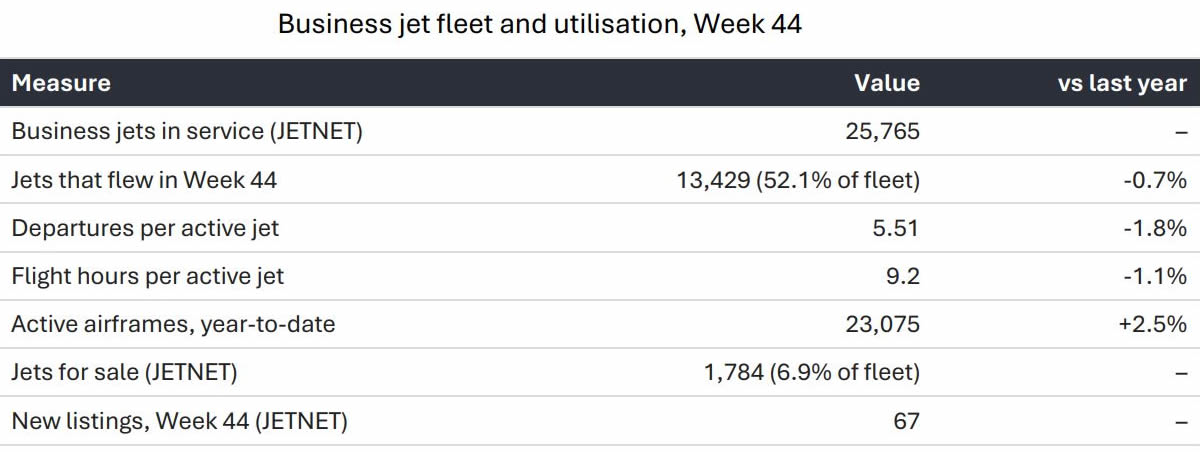
Combining WINGX flight data with JETNET fleet records, in Week 44, the number of active jets slipped 0.7% in Week 44, while departures per active jet fell 1.8% and flight hours per jet 1.1%. The number of jets listed for sale rose for a fourth consecutive week, to 1,784, and new listings rose to 67.
Business jet fleet and utilisation, Week 44.
click image to enlarge
Looking Ahead to Week 45
- Post-Halloween recovery: with the Halloween lull out of the comparison, Week 45 will
show whether last week’s softness was a one-off. - Fleet supply: jets for sale have risen for four weeks running; a continued build-up would
point to softening pre-owned demand. - Fourth quarter: comparisons stay tough through November, when growth reached +9.4%
in 2025.
Conclusion
Nick Koscinski, WINGX Analyst, comments, "Global activity was down 2.4% last week. Halloween week is always quiet in the US, and this year’s was a bit quieter than usual, plus the postponed FII conference in Riyadh sitting in last year’s numbers.
"Fractional is still the bright spot, while charter continues to dip. On the fleet side, jets for sale have edged up for four straight weeks to 1,784, which is worth watching as we head into year-end.”
Note: Figures cover business jets including VIP/bizliner aircraft. All figures exclude turboprops.
This bulletin is produced by WINGX, part of the JETNET Group. The JETNET Group is an independent organisation with no commercial affiliation with BlueSky News. All references to products, services, and events in this bulletin are editorial in nature and have not been paid for or sponsored by any third party.



"Global activity was down 2.4% last week. Halloween week is always quiet in the US, and this year’s was a bit quieter than usual, plus the postponed FII conference in Riyadh sitting in last year’s numbers.
"Fractional is still the bright spot, while charter continues to dip. On the fleet side, jets for sale have edged up for four straight weeks to 1,784, which is worth watching as we head into year-end.”
Nick Koscinski
WINGX Analyst.
WINGX GmbH
Lilienstraße 11
20095 Hamburg
Germany.
+49 40 23 96 85 05
BlueSky Business Aviation News | 5th November 2026 | Issue #865

| © BlueSky Business Aviation News Ltd 2008-2026 |