


WINGX Global Market Tracker:
NBAA-BACE shines as global business jet activity
back into growth in Week 43
Global bizjet activity returned to growth in Week 43 (19-25 Oct), up 0.7% year-on-year with just over 81,750 departures operated globally.
Notably, some of the improvement came from the NBAA-BACE convention in Las Vegas, which fell a week later this year than in 2025; excluding Nevada, global departures were up just 0.3%.
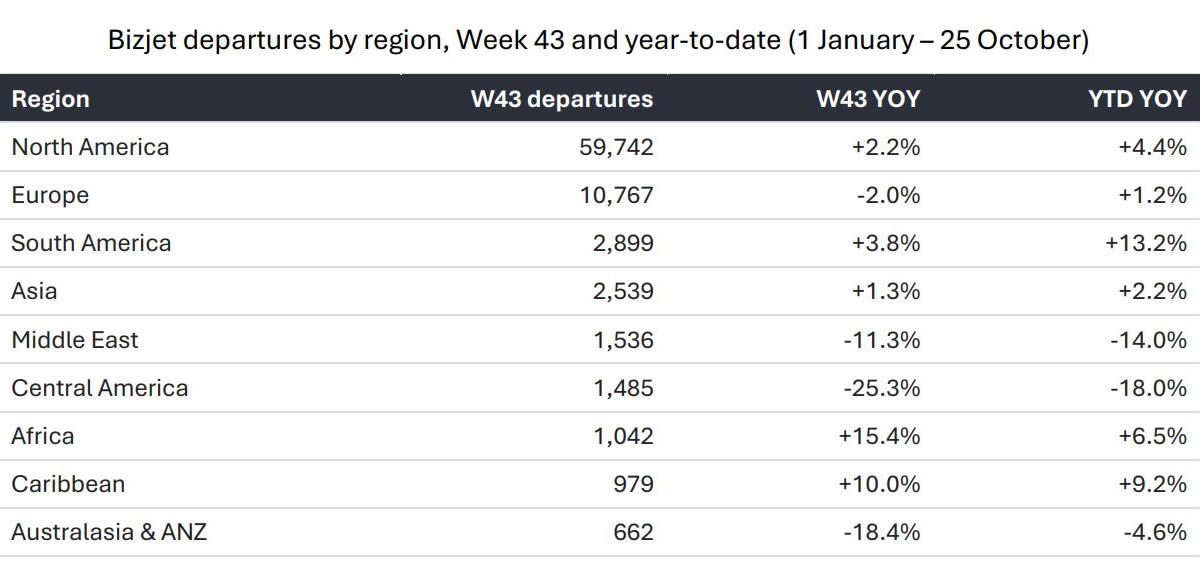
The four-week trend has slowed to +0.7%, and the year-to-date figure stands at +3.2% ahead of last year through 25 October. North America grew 2.2%, while Europe slipped 2.0% and Central America (-25.3%) and the Middle East (-11.3%) remained the weakest regions last week.
What Drove the Week
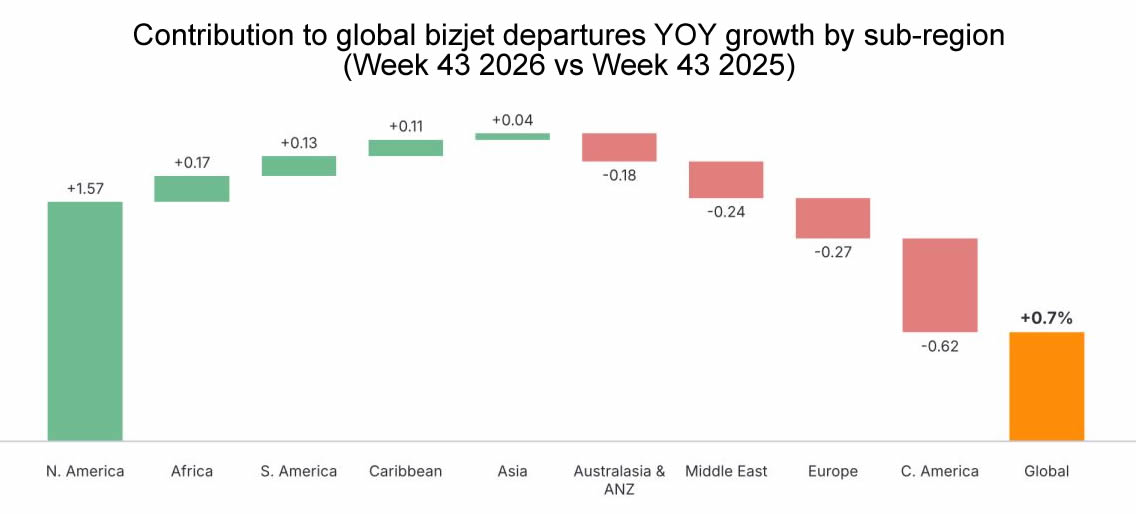
The chart below breaks global growth down by sub-region. North America added +1.57 points, with Nevada alone contributing almost half a point. Africa, South America and the Caribbean added a further +0.41 points on a combined basis. Central America (-0.62 points), Europe (-0.27 points) and the Middle East (-0.24 points) took back around two-thirds of the gains.
Contribution to global bizjet departures YOY growth by sub-region (Week 43 2026 vs Week 43 2025).
click image to enlarge
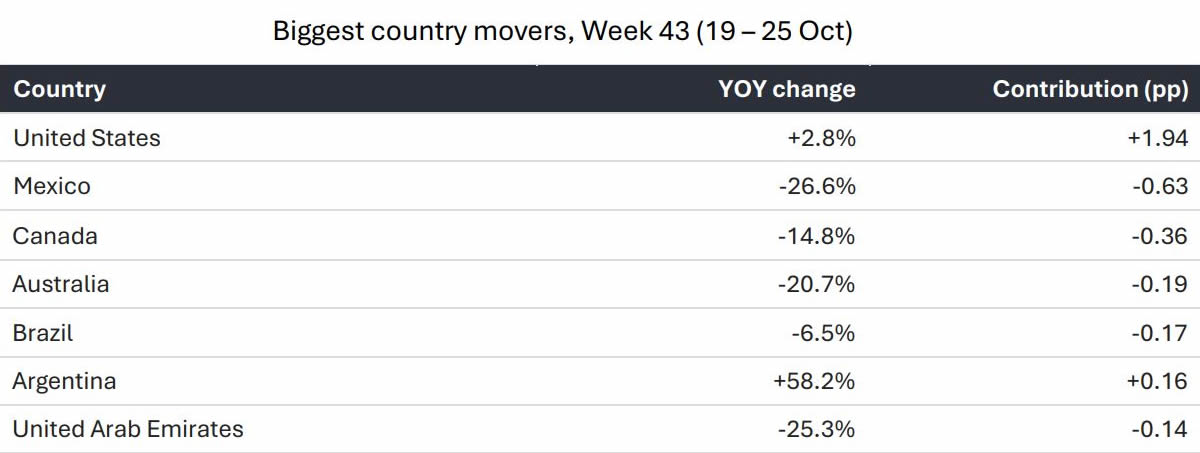
On a top country basis last week, the United States, up 2.8%, was by far the largest contributor to global growth, while Mexico (-26.6%) and Canada (-14.8%) were the largest drags.
Biggest country movers, Week 43 (19-25 Oct) Country YOY change Contribution (pp).
click image to enlarge
Trend Context
The chart below puts Week 43 in context. Weekly year-on-year growth held largely in a 2–4% range through the summer and early autumn, but has run at or below 1% for the last three weeks as 2026 is compared against the start of last year’s strong fourth quarter. The NBAABACE timing shift pulled Week 42 negative and lifted Week 43, so the two weeks are best read together: combined, they were essentially flat year-on-year (-0.1%). Within the week, activity was steady, with Friday to Sunday up 1.4% and Monday to Thursday up 0.3%.
Global business jet departures, YOY % change by week (Weeks 32-43, 2026 vs 2025).
click image to enlarge
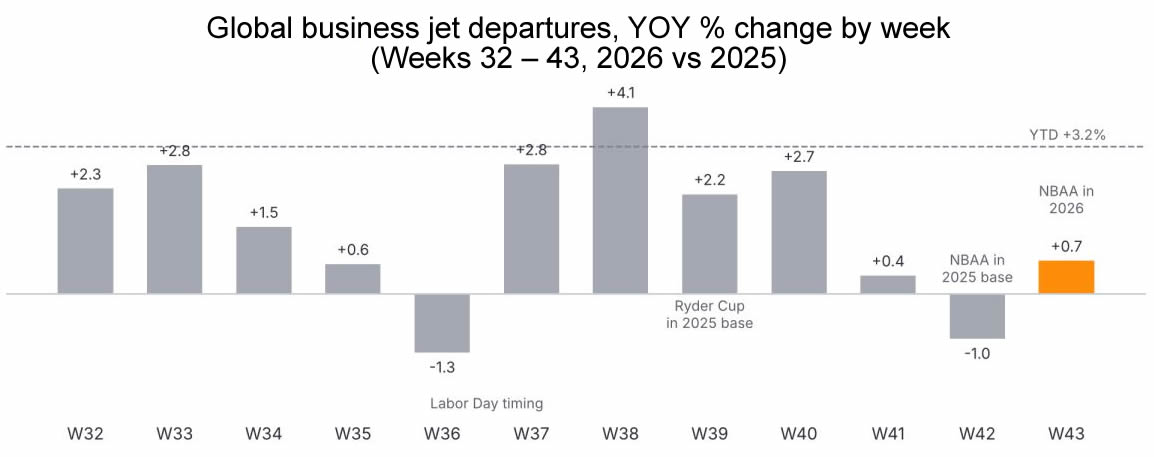
The four-week trend of +0.7% now sits well below the year-to-date +3.2%, the clearest sign yet that growth has slowed since the summer.
Regional Performance Analysis in Week 43
Bizjet departures by region, Week 43 and year-to-date (1 January-25 October).
click image to enlarge
North America
The North American market grew 2.2% year-on-year last week, with just under 59,750 departures. The United States accounted for roughly 97% of North American flights (and around 71% of all global departures) with 58,022 flights, up 2.8%, while Canada fell 14.8%.
Nevada led the gains, up 32.8% as NBAA-BACE brought traffic to Las Vegas, and Texas (+6.2%), New Jersey (+7.7%) and Florida (+3.2%) also grew. Excluding Nevada, US departures were up 2.2%. New York (-7.4%), Colorado (-9.9%) and California (-1.8%) declined. On a year-to-date basis, North America remains the anchor of global growth, up 4.4%.
Europe
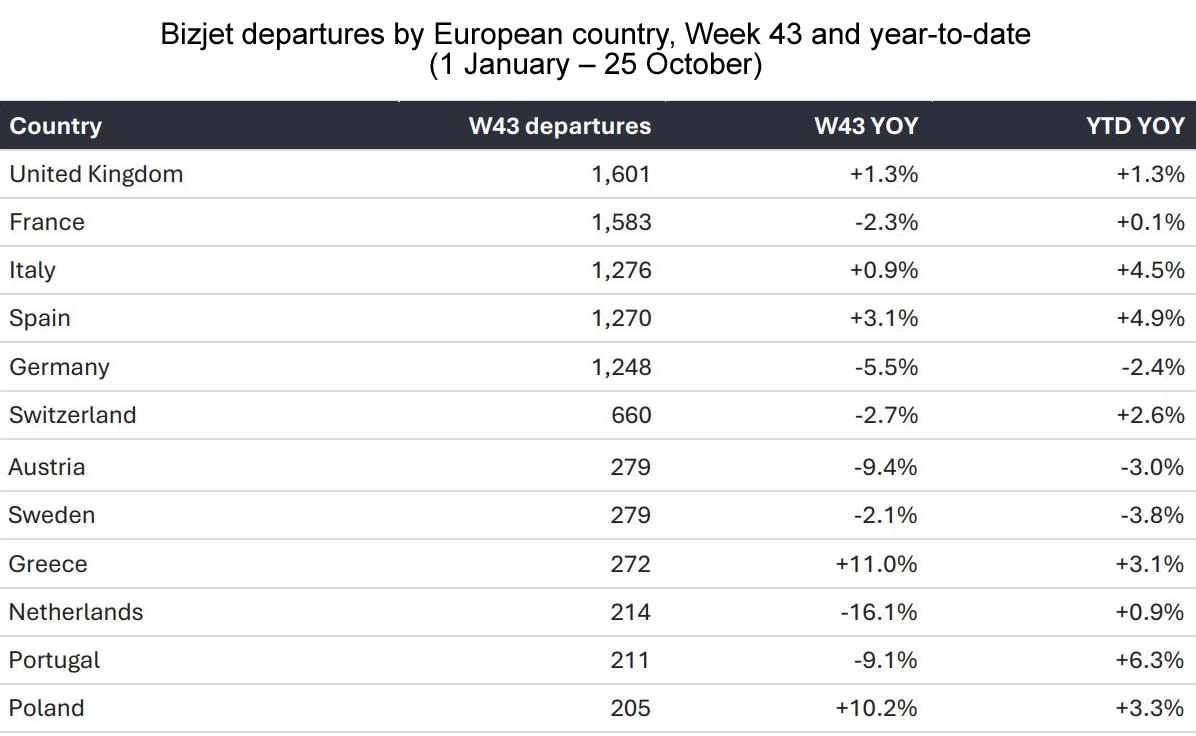
European business jet traffic eased 2.0% year-on-year in Week 43 with just under 10,800 flights, and its year-to-date trend sits at +1.2%. Among the largest markets, Spain (+3.1%), the UK (+1.3%) and Italy (+0.9%) grew, while Germany fell 5.5%, Switzerland 2.7% and France 2.3%. Among mid-sized markets, Greece (+11.0%) and Poland (+10.2%) grew strongly, while the Netherlands and Belgium were both down around 16%.
Bizjet departures by European country, Week 43 and year-to-date (1 January-25 October).
click image to enlarge
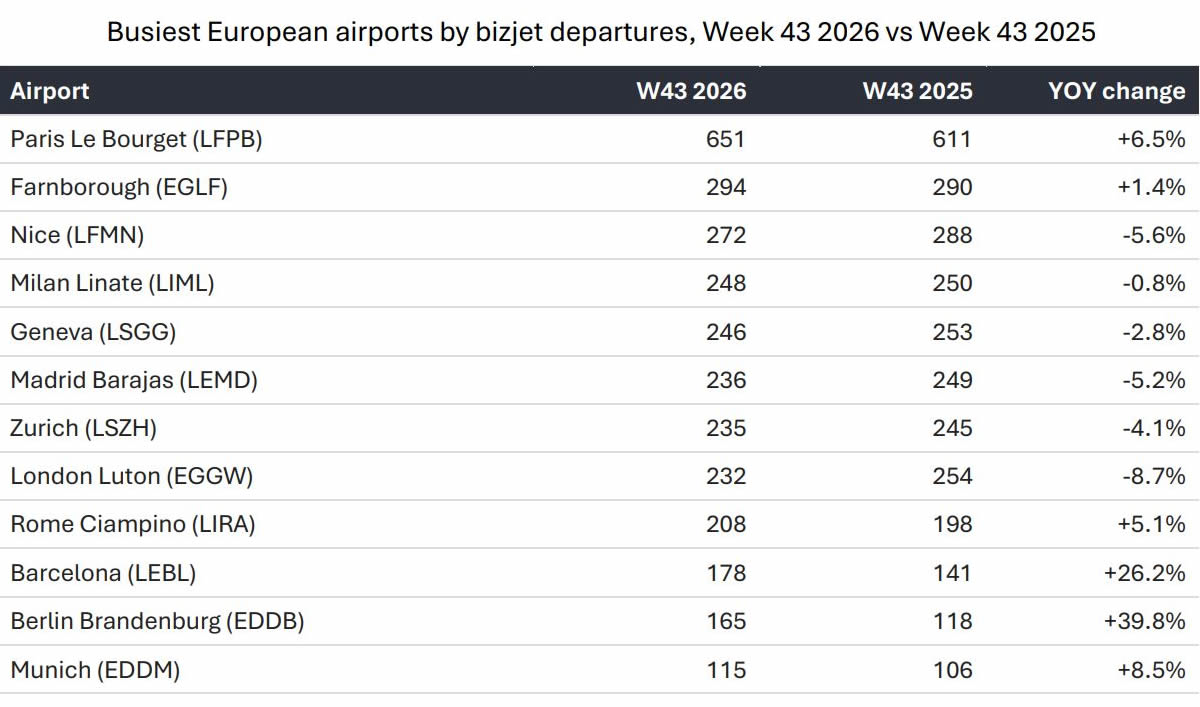
At the airport level, Paris Le Bourget remained Europe’s busiest business aviation airport, up 6.5% year-on-year. Despite the unrest across French cities that peaked on Saturday 17 October, Le Bourget departures were also up 7.6% in Week 42, so there is no sign yet that the protests have weighed on Paris business jet traffic. Nice, France’s second-busiest airport, fell 5.6%. Elsewhere, Berlin Brandenburg (+39.8%), Barcelona (+26.2%) and Munich (+8.5%) grew, while London Luton (-8.7%) and Madrid (-5.2%) declined.
Busiest European airports by bizjet departures, Week 43 2026 vs Week 43 2025.
click image to enlarge
Rest of the World
Outside Europe and North America, Africa (+15.4%) and the Caribbean (+10.0%) posted the strongest growth, though both from small bases. South America rose 3.8%, with Argentina (+58%) and Venezuela (+62%) offsetting a 6.5% decline in Brazil. Argentina’s gain was concentrated in Buenos Aires, with San Fernando up 59% and Aeroparque Jorge Newbery up
81%. Asia’s surge from the previous week faded, with the region up just 1.3%.
Australasia & ANZ fell 18.4%, with Australia down 20.7%. The decline was broad-based across operator types, including air ambulance (-28%), aircraft management (-22%), corporate flight departments (-30%) and charter (-33%), and across the main airports, with Sydney Kingsford Smith down 27% and Melbourne Essendon 31%.
In the Middle East, Gulf departures fell 35.7% year-on-year, with the UAE down 25.3% and Saudi Arabia 43.9%, while Turkey, the region’s largest market, rose 14.9%.
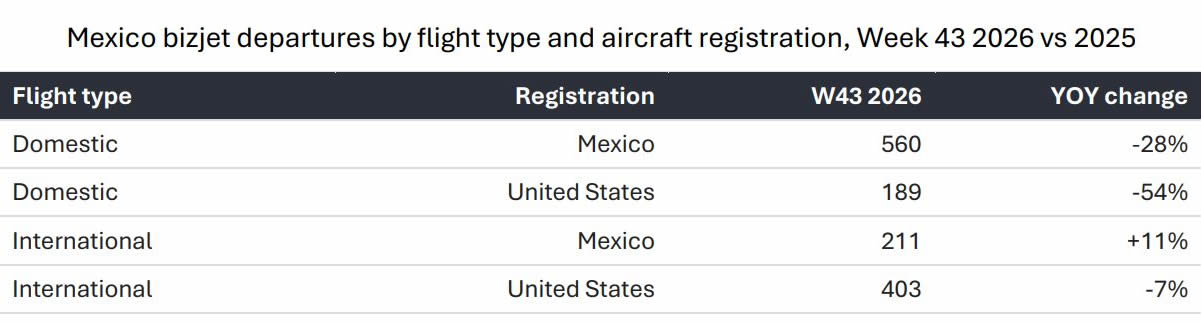
Mexico fell 26.6%, and the data points to a sharp drop in domestic flying rather than in crossborder traffic. Flights within Mexico fell by around 37% year-on-year, while international departures, mostly to the US, were down only around 3%.
The steepest decline was in domestic flights by US-registered jets, which more than halved, while Mexican-registered domestic flights fell 28%. By airport, Toluca (-34%), Monterrey (-29% at Del Norte, -35% at Escobedo), Querétaro (-34%) and Cancún (-32%) all fell sharply, while Los Cabos held up better (-15%).
By operator type, private flight departments saw the largest drop, down 43%. The pattern has persisted all year: domestic Mexican departures are down 30% year-to-date, against -1.6% for international.
Mexico bizjet departures by flight type and aircraft registration, Week 43 2026 vs 2025.
click image to enlarge
Mover of the Week: NBAA-BACE in Las Vegas
Business jet movements at Las Vegas’ three airports reached 2,599 in Week 43, up 31.5% on the same week last year, as the NBAA-BACE convention came to the city a week later than in 2025. The arrival day stood out with Monday movements up 67%, along with growth of 37–47% on each day from Tuesday to Thursday.
Business jet movements at Las Vegas airports (KLAS, KHND, KVGT) by week, 2025 vs 2026.
click image to enlarge
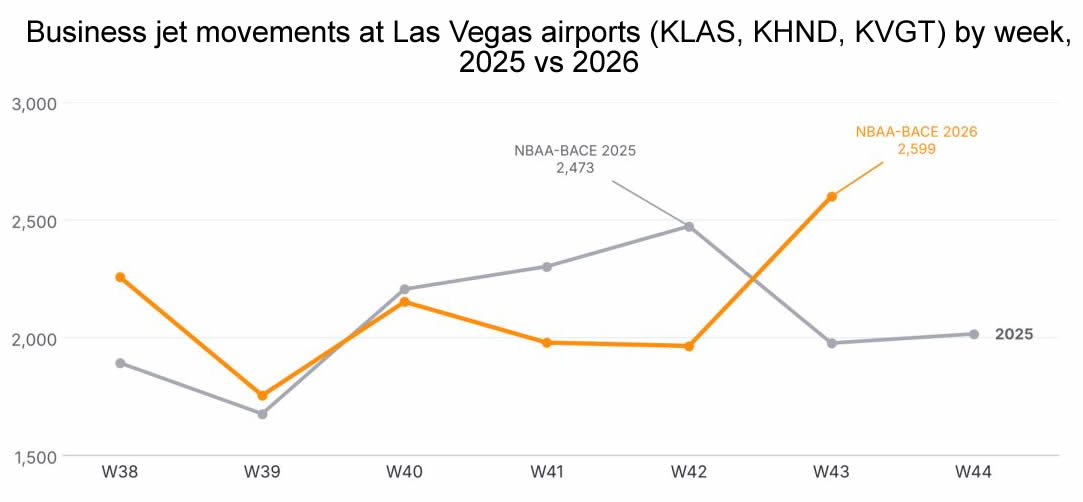
This year’s peak of 2,599 movements was slightly above last year’s 2,473, suggesting the show drew similar or slightly higher business jet traffic. Nevada added almost 0.5 percentage points to global growth in Week 43, after subtracting a similar amount in Week 42, when last year’s show sat in the comparison.
Who Is Flying
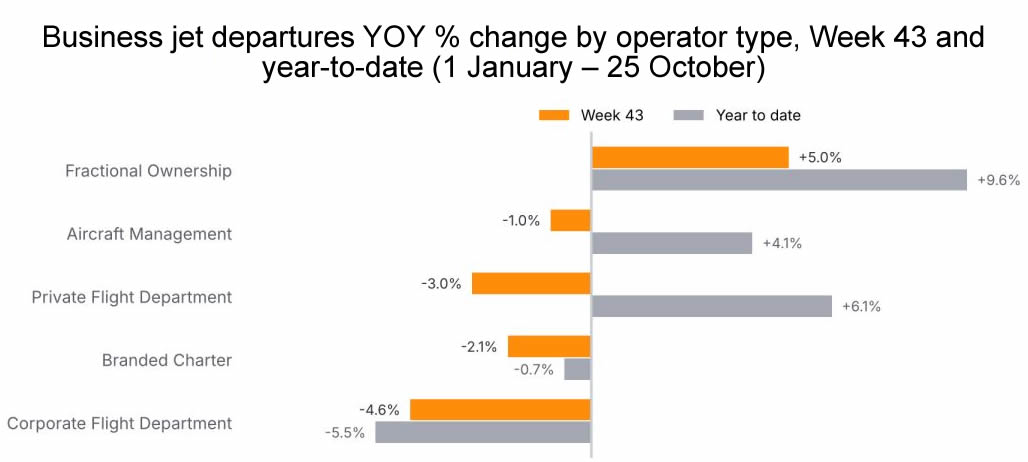
Fractional operators were the only major operator type to grow in Week 43, up 5.0% and adding almost a full percentage point to global growth. Aircraft management slipped 1.0%, private flight departments 3.0% and corporate flight departments 4.6%. Branded charter fell for another consecutive week, down 2.1%, although the drop was milder than in the previous weeks;
North American charter was down 2.6%, while Europe rose 1.9%. Year-to-date, fractional activity remains the strongest segment, up 9.6%, followed by private flight departments (+6.1%) and aircraft management (+4.1%), while corporate flight departments are down 5.5% and branded charter 0.7%.
Business jet departures YOY % change by operator type, Week 43 and year-to-date (1 January-25 October).
click image to enlarge
Fleet Lens
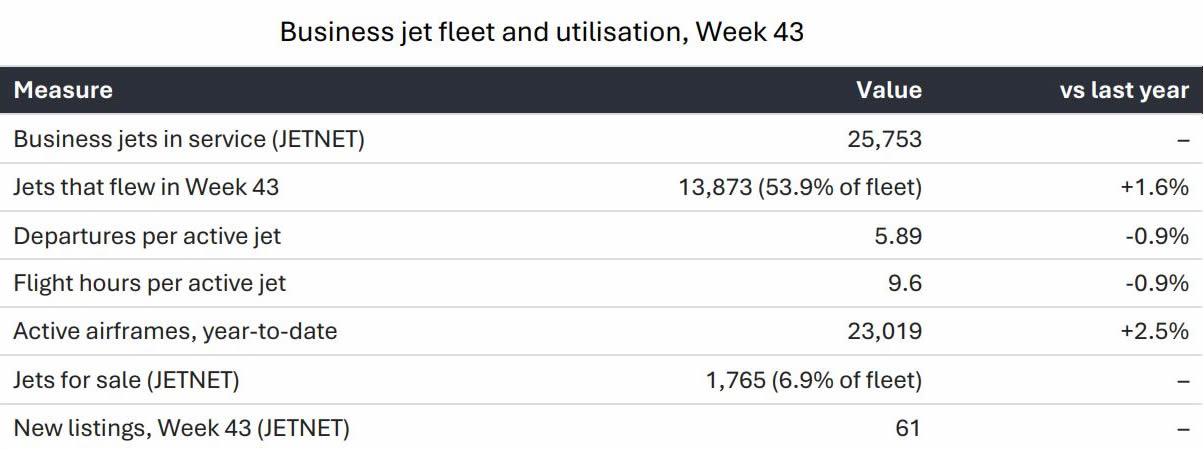
Combining WINGX flight data with JETNET fleet records shows that, as in Week 42, more jets flew but each flew slightly less. The number of active jets rose 1.6%, while departures per active jet and flight hours per jet both fell 0.9%. The number of jets listed for sale rose for a third consecutive week, to 1,765.
Business jet fleet and utilisation, Week 43.
click image to enlarge
Looking Ahead to Week 44
- Underlying trend: with NBAA-BACE out of both years’ comparisons, Week 44 offers a
cleaner read on whether growth has settled around 1%. - Fleet supply: jets for sale have risen for three weeks running; a continued build-up would
point to softening pre-owned demand. - Fourth quarter: comparisons stay tough through November, when growth reached +9.4%
in 2025.
Conclusion
Nick Koscinski, WINGX Analyst, comments, “Global activity was back in the black last week at +0.7%, with NBAA-BACE notably contributing to that growth. Fractional is still the bright spot, while Mexico and now Canada remain the biggest drags.
"On the fleet side, more jets are flying than a year ago, but each is flying slightly less, and the number of jets for sale has edged up for three weeks running to 1,765, which is worth watching heading into year-end.”
Note: Figures cover business jets including VIP/bizliner aircraft. All figures exclude turboprops.
This bulletin is produced by WINGX, part of the JETNET Group. The JETNET Group is an independent organisation with no commercial affiliation with BlueSky News. All references to products, services, and events in this bulletin are editorial in nature and have not been paid for or sponsored by any third party.



“Global activity was back in the black last week at +0.7%, with NBAA-BACE notably contributing to that growth. Fractional is still the bright spot, while Mexico and now Canada remain the biggest drags.
"On the fleet side, more jets are flying than a year ago, but each is flying slightly less, and the number of jets for sale has edged up for three weeks running to 1,765, which is worth watching heading into year-end.”
Nick Koscinski
WINGX Analyst.
WINGX GmbH
Lilienstraße 11
20095 Hamburg
Germany.
+49 40 23 96 85 05
BlueSky Business Aviation News | 29th October 2026 | Issue #864

| © BlueSky Business Aviation News Ltd 2008-2026 |