


WINGX Global Market Tracker:
US demand lifts global business jet activity 2.6% in Week 40
Global bizjet activity rose 2.6% year-on-year in Week 40 (28 Sept-4 Oct), with just over 79,600 departures operated globally. With no major event inflating last year’s comparison, Week 40 offers a clean read on underlying demand, and the four-week trend now stands at +3.0%.
The year-to-date figure is +3.4% ahead of last year through 4 October. North America accounted for almost all of the global growth, up 3.9% on the week, while Europe added a modest +2.1%. The Middle East slipped back 12.1% after returning to growth the previous week, while Central America was the weakest sub-region, down 23.9%.
What Drove the Week
The chart below breaks down global growth by sub-region, showing how many percentage points each added or subtracted. North America contributed +2.76 points of the +2.6% global gain. Europe (+0.33 points) and Africa (+0.26 points) added most of the remainder, while Central America (-0.48 points) and the Middle East (-0.24 points) held growth back.
Contribution* to global bizjet departures YOY growth by sub-region (Week 40 2026 vs
Week 40 2025).
click image to enlarge
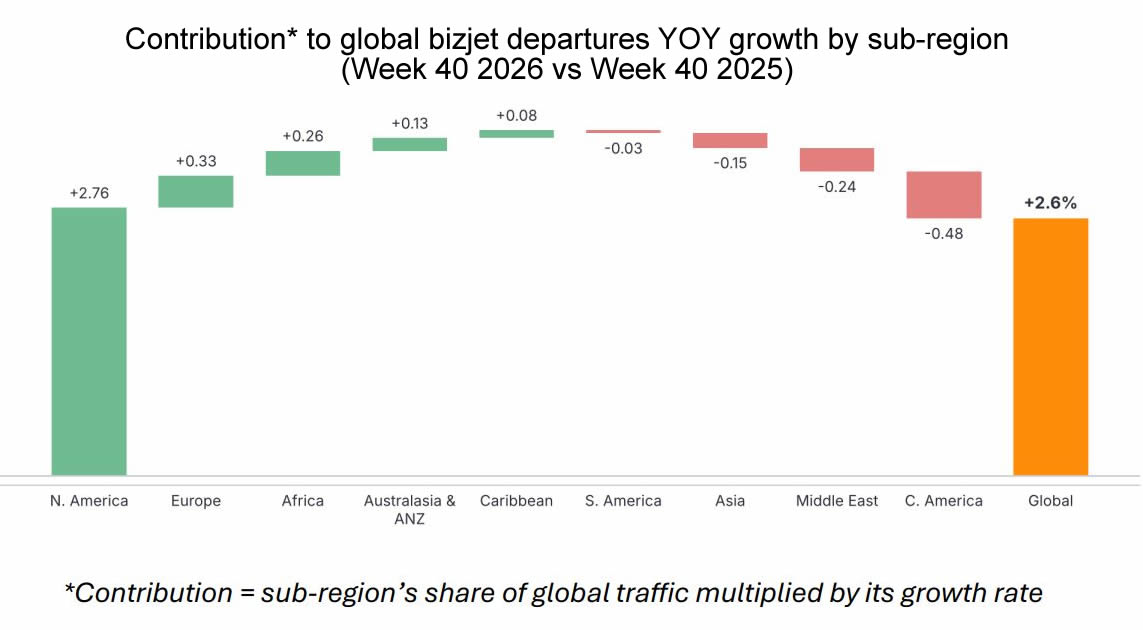
*Contribution = sub-region’s share of global traffic multiplied by its growth rate.
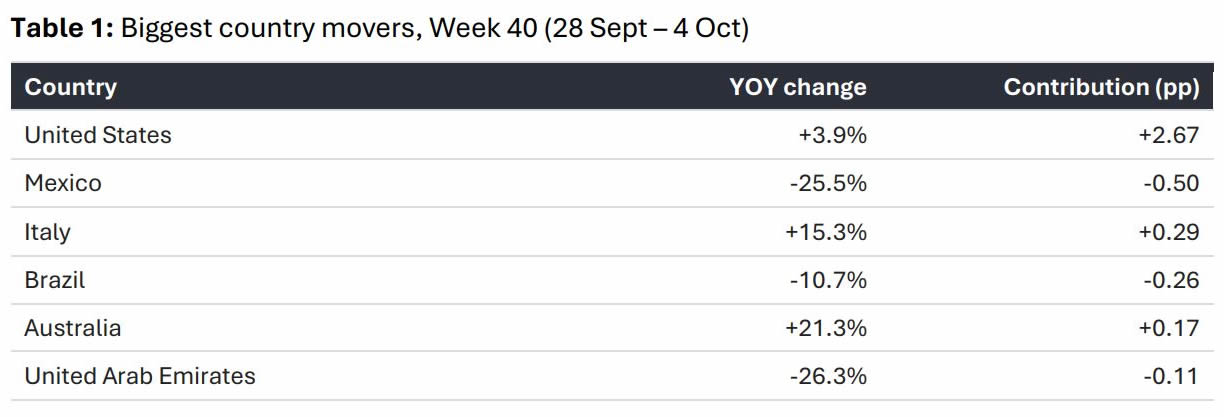
Growth rates alone can overstate smaller markets that operate from smaller absolute bases, so the table below ranks the week’s biggest country movers by their contribution to global growth. The United States, up 3.9%, added 2.7 points on its own, while Mexico’s 25.5% decline was the largest single country drag.
Biggest country movers, Week 40 (28 Sept-4 Oct).
click image to enlarge
Trend Context
The chart below helps put Week 40 in context. Weekly year-on-year growth has held largely in a 2–4% range since July, with the main exceptions explained by the calendar: Labor Day fell a week later in 2026, pulling Week 36 negative and lifting Week 37, while last year’s Ryder Cup at Bethpage inflated the Week 39 comparison. Week 40 grew faster than Week 39 as that event dropped out of the base. Growth was strongest midweek, with Wednesday up 7.4% and Thursday up 5.5%, while Sunday was the only day down on last year, at -3.3%.
Global business jet departures YOY % change by week (Weeks 29-40 2026 vs 2025).
click image to enlarge
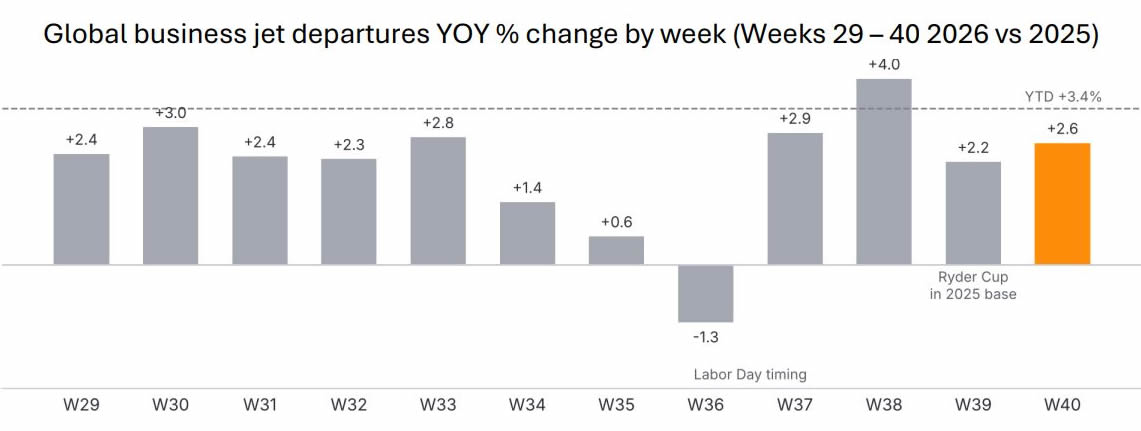
With late-arriving data now settled, recent weeks read slightly higher than first reported, with Week 39 revised to +2.2%. The four-week trend of +3.0% sits just below the year-to-date +3.4%, consistent with a market that is growing steadily, even if more slowly than the mid-to-high single-digit pace seen in the second half of last year.
Regional Performance Analysis in Week 40
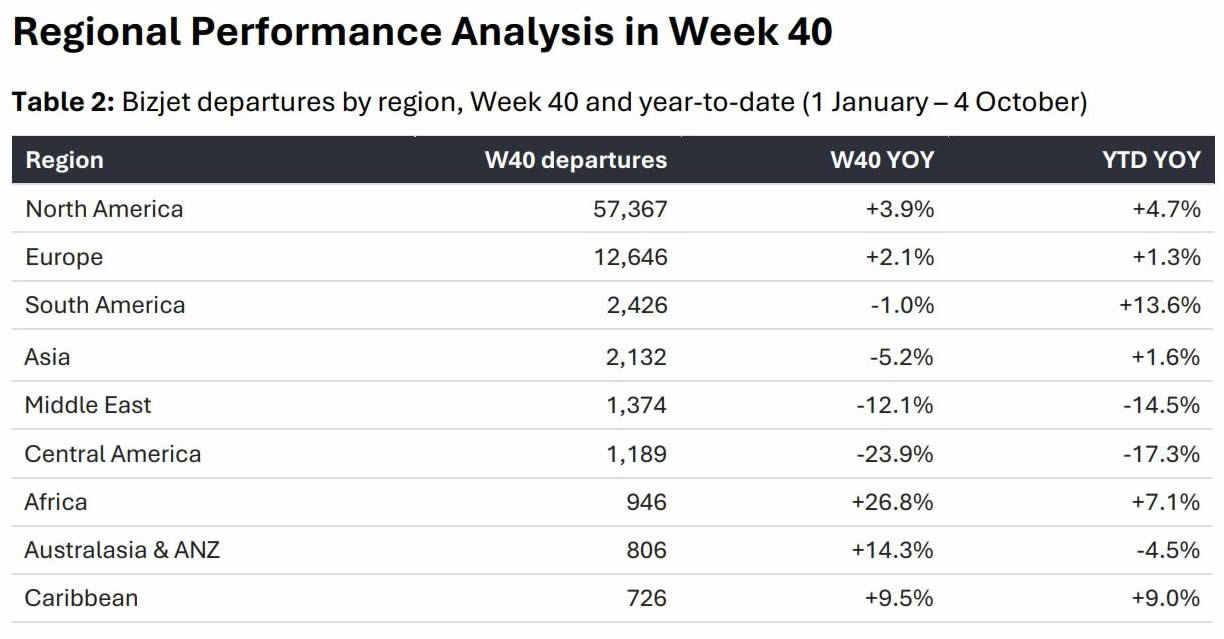
Bizjet departures by region, Week 40 and year-to-date (1 January-4 October).
click image to enlarge
North America
The North American market led global growth last week, with demand up 3.9% year-on-year and just over 57,350 departures. The United States drove the trend, accounting for roughly 97% of North American flights (and around 70% of all global departures) with 55,472 flights, up 3.9%. Interestingly, the largest states were not the source of the gain with Florida and Texas both flat on the week, while California rose 4.2%. Instead, growth came from New Jersey (+12.7%, with Teterboro up 11.1%), Virginia (+24%), South Carolina (+23%) and Georgia (+10%).
Canada edged up 2.1%. On a year-to-date basis, North America remains the anchor of global growth, up 4.7%.
Europe
European business jet traffic grew 2.1% year-on-year in Week 40 with just over 12,600 flights, and its year-to-date trend now sits at +1.3%. Country-level performance was again mixed with Italy leading the top markets, up 15.3%, while Milan Linate up 10%, a sharp turnaround from its decline the previous week. France rose 2.6% and Germany 3.2%, while the UK was flat. In contrast, Spain slipped 3.3%, Switzerland 2.8% and Austria 9.8%.
Rest of the World
Regions outside Europe and North America again saw sharply split trends. Africa was the standout, up 26.8% (though off a small base), followed by Australasia & ANZ at +14.3%, where Australia rose 21.3%, and the Caribbean at +9.5%. South America dipped 1.0%, as Brazil fell 10.7% after a strong prior week, and Asia declined 5.2%.
Mexico remains the main drag amongst Rest of World countries, departures falling 25.5% on the week, with flights by US-registered jets down 37%, a steeper decline than Mexican registered jets (-18%). The softness has now reached Los Cabos, which had been the country’s bright spot: Los Cabos Intl and Cabo San Lucas Intl together handled 54 departures, against 109 in the same week last year. Toluca fell 26% and Guadalajara 38%.
Mover of the Week to Watch: The Gulf
The Middle East fell 12.1% in Week 40, with the Gulf states accounting for the decline. Business jet departures from the UAE, Saudi Arabia, Qatar, Bahrain, Kuwait and Oman reached 514 last week, close to their post-February high of 518 in Week 36, yet still 22.2% below the same week in 2025. Gulf activity has risen by around three-quarters since early August, but last year’s autumn ramp-up was steeper still, so the gap to 2025 has reopened as the seasonal return gets underway.
Weekly business jet departures from six GCC countries, Weeks 2-40 2025 vs 2026.
click image to enlarge
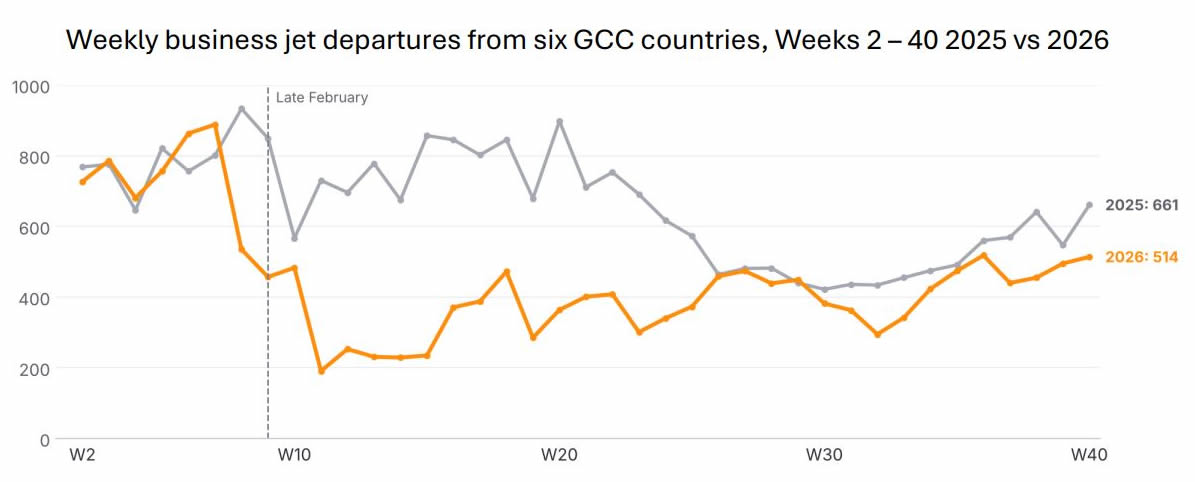
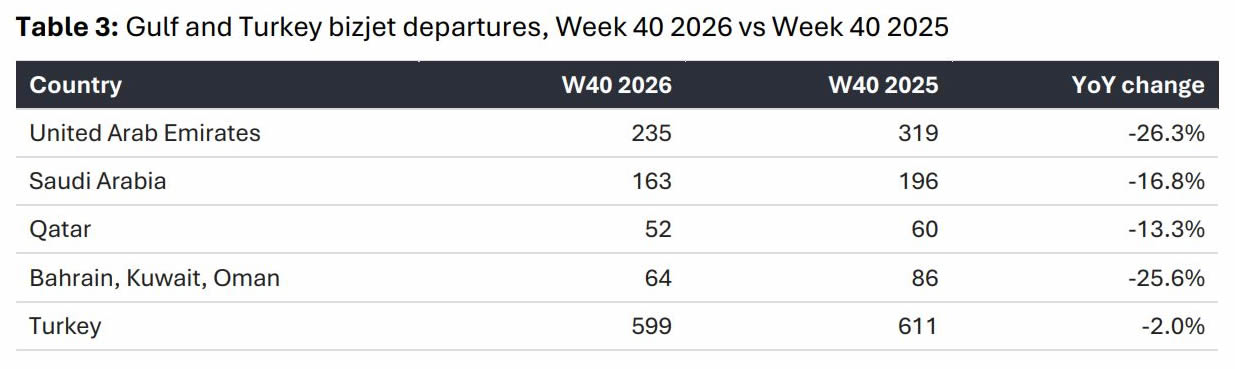
The UAE accounted for most of the shortfall, down 26.3%, while Saudi Arabia and Qatar fell 16.8% and 13.3% respectively. Turkey, the region’s largest market, held close to last year at - 2.0%. Over the summer months, Gulf activity tracked close to 2025 levels, and year-to-date it remains around 32% below last year, with the sharpest declines recorded from late February.
Gulf and Turkey bizjet departures, Week 40 2026 vs Week 40 2025.
click image to enlarge
Who Is Flying
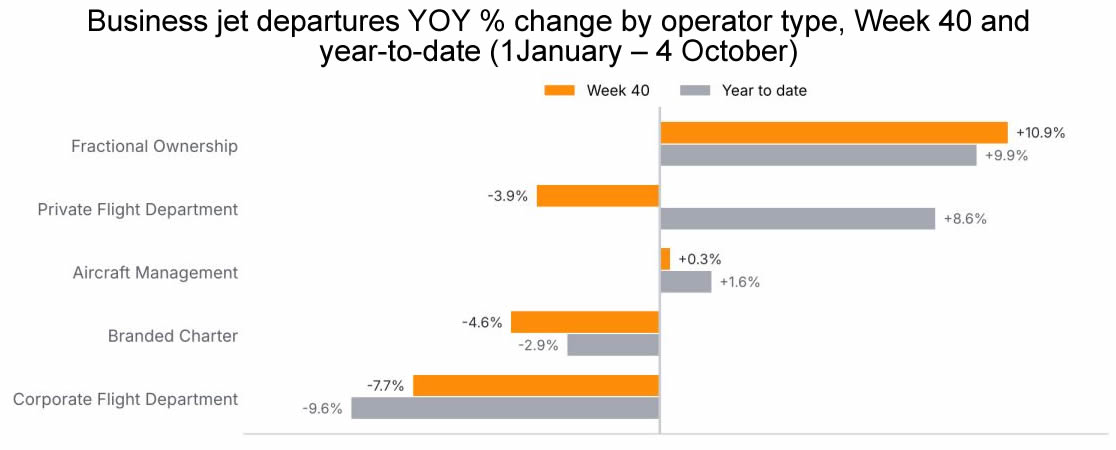
Fractional operators continued to lead growth, up 10.9% on the week and adding more than 2 percentage points to global growth on their own. Year-to-date, fractional activity is up 9.9%, with private flight departments close behind at +8.6%, although the latter dipped 3.9% last week. Corporate flight departments remain down, off 7.7% on the week and 9.6% year-to-date.
Branded charter fell 4.6%, a second consecutive soft week for the most price-sensitive segment of the market.
Business jet departures YOY % change by operator type, Week 40 and year-to-date (1 January-4 October).
click image to enlarge
Fleet Lens
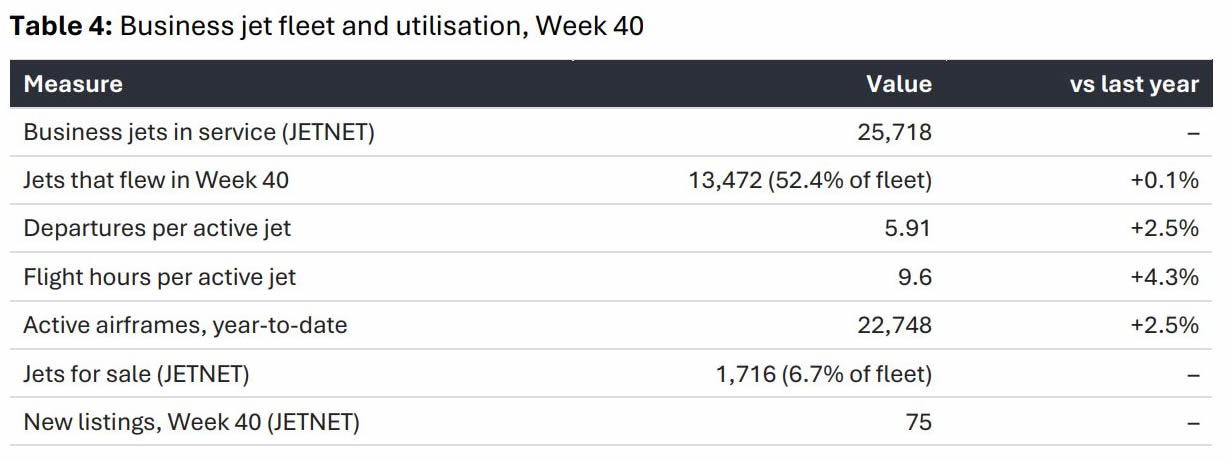
Combining WINGX flight data with JETNET fleet records shows that Week 40’s growth came from each aircraft flying more, rather than from more aircraft flying. The number of active jets rose just 0.1%, while departures per active jet rose 2.5% and flight hours per jet 4.3%, meaning trips were longer as well as more frequent.
Business jet fleet and utilisation, Week 40.
click image to enlarge
Looking Ahead to Week 41
-
Weekend activity: Friday to Sunday grew just 0.8% in Week 40, against +3.9% Monday to
Thursday. A second soft weekend would point to cooling leisure demand. -
Charter: branded charter has now fallen two weeks running; a third could confirm a
softening trend. -
The Gulf: last year’s Gulf traffic kept climbing through October, so the coming weeks will
show whether 2026 is on any sort of recovery trend. -
Mexico: a second weak week in Los Cabos would suggest the decline in US-registered
traffic has spread to the country’s resort markets. -
Fourth quarter: October and November 2025 were the strongest months of last year
(+9.4% in November), so year-on-year comparisons get tougher from here.
Conclusion
Nick Koscinski, WINGX Analyst, comments, “Global activity was up 2.6% last week, and with no Ryder Cup in last year’s numbers, I think that’s a fair read of where demand really is. The US did almost all of the work, and fractional operators are still the ones driving it, while charter has now been soft for two weeks in a row.
"The Gulf is back near its best levels since February, which is encouraging, but it’s still a fifth below last year, and Mexico continues to slide, now including Los Cabos.”
Note: Figures cover business jets including VIP/bizliner aircraft. All figures exclude turboprops.
This bulletin is produced by WINGX, part of the JETNET Group. The JETNET Group is an independent organisation with no commercial affiliation with BlueSky News. All references to products, services, and events in this bulletin are editorial in nature and have not been paid for or sponsored by any third party.



“Global activity was up 2.6% last week, and with no Ryder Cup in last year’s numbers, I think that’s a fair read of where demand really is. The US did almost all of the work, and fractional operators are still the ones driving it, while charter has now been soft for two weeks in a row.
"The Gulf is back near its best levels since February, which is encouraging, but it’s still a fifth below last year, and Mexico continues to slide, now including Los Cabos.”
Nick Koscinski
WINGX Analyst.
WINGX GmbH
Lilienstraße 11
20095 Hamburg
Germany.
+49 40 23 96 85 05
BlueSky Business Aviation News | 8th October 2026 | Issue #861

| © BlueSky Business Aviation News Ltd 2008-2026 |