


WINGX Global Market Tracker:
Emerging markets diverge as global business jet traffic eases 1% in Week 39
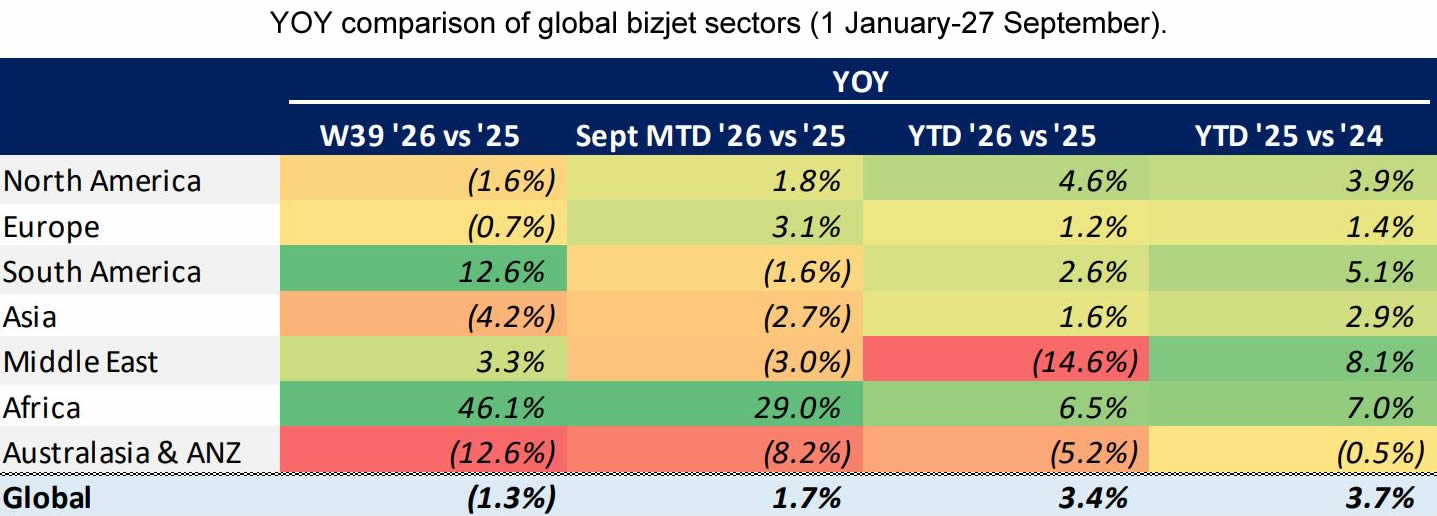
After two consecutive flat weeks, global bizjet activity eased 1.3% year-on-year in Week 39 (21-27 Sept), with just under 79,500 departures operated globally. The year-to-date figure now stands at +3.4% ahead of last year through 27 September, 0.3 percentage points below the comparable growth trend for the same dates in 2025 vs 2024.
The Middle East returned to slight weekly growth at +3.3% but remains sharply down yearto-date at -14.6%, while bizjet demand stayed weak in Australasia & ANZ, off 12.6% on the week. While accounting for only 1.2% of global bizjet traffic last week, Africa again posted the most notable growth, up 46.1%.
YOY comparison of global bizjet sectors (1 January-27 September).
click image to enlarge
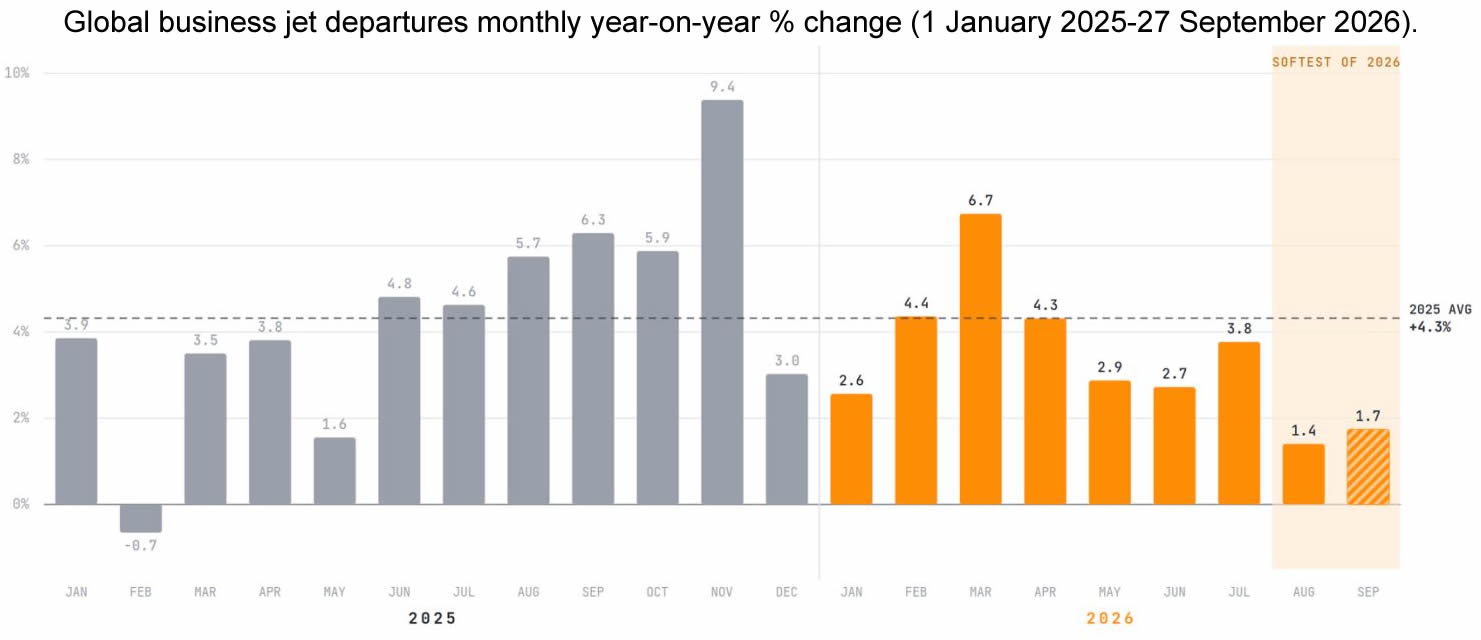
The chart below helps put the recent softness in bizjet growth into context. Monthly year-on-year growth built steadily throughout 2025, averaging 4.3% and peaking at 9.4% in November, before starting to cool off in 2026. The deceleration in global bizjet growth has been most evident over the late summer months, with August and September at just 1.4% and 1.7%, respectively, well below the 5.7% and 6.3% growth rates the same months realized last year. These last two months of relatively softer growth is what has nudged the 2026 year-to-date trend to now below the comparable 2025 vs 2024 period.
Most importantly, this represents a slowing pace of growth, rather than any structural demand contraction, with global volumes remaining above 2025 in every month of the year. Part of the deceleration is simply 2026 being compared against the strongest stretch of last year, when growth accelerated in the mid-to-high single-digits. Crucially, the wider demand fundamentals for bizjets remain intact, with record corporate profits, a still growing ultra-high net worth individual population, and expanding OEM backlogs, all pointing to the bizjet market still standing on strong footing.
Global business jet departures monthly year-on-year % change (1 January 2025-27 September 2026).
click image to enlarge
Regional Performance Analysis in Week 39
North America
The North American market broadly tracked the global trend last week, though a touch below it, with demand down 1.6% year-on-year and just over 56,000 departures. The United States drove the trend, accounting for roughly 97% of North American flights (and around 68% of all global departures) with 54,445 flights, down 1.5%. The regional dip came despite firm growth across the largest states: bizjet flights from airports in Florida were up 8.7% and Texas up 6.4%, while California was essentially flat at -0.3%.
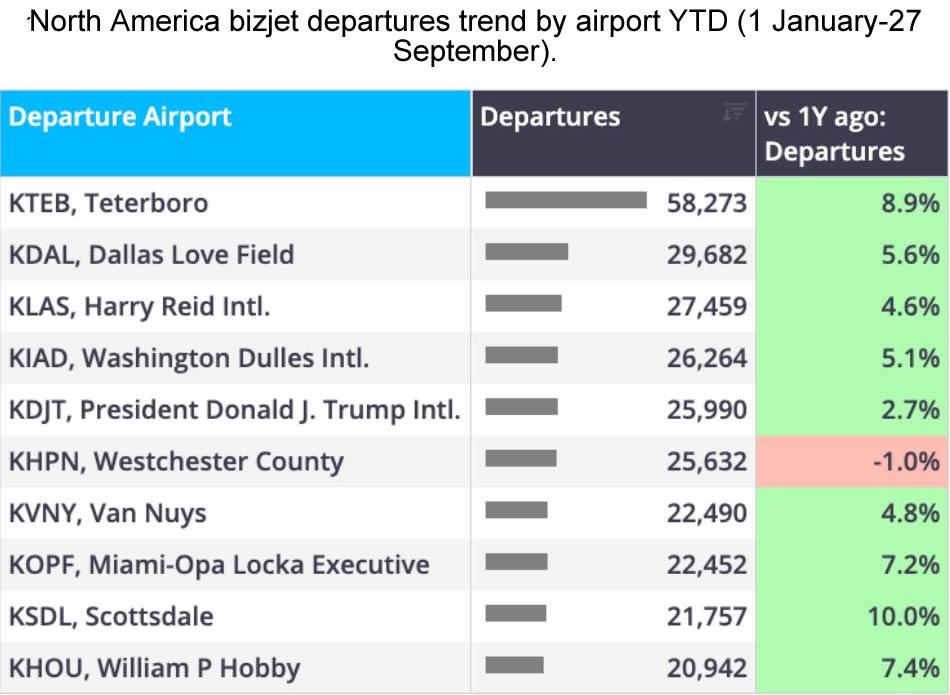
On a year-to-date basis, North America remains the anchor of global growth, up 4.6%. The below table ranks North America's bizjet departures by airport on a year-to-date basis (1 January – 27 September), showing both volume and year-on-year change.
Amongst top airports, Teterboro leads on total volume, while also posting robust 8.9% year-to-date growth, while Scottsdale leads in growth amongst top airports, 10.0% above year-to-date 2025 levels.
North America bizjet departures trend by airport YTD (1 January-27 September).
click image to enlarge
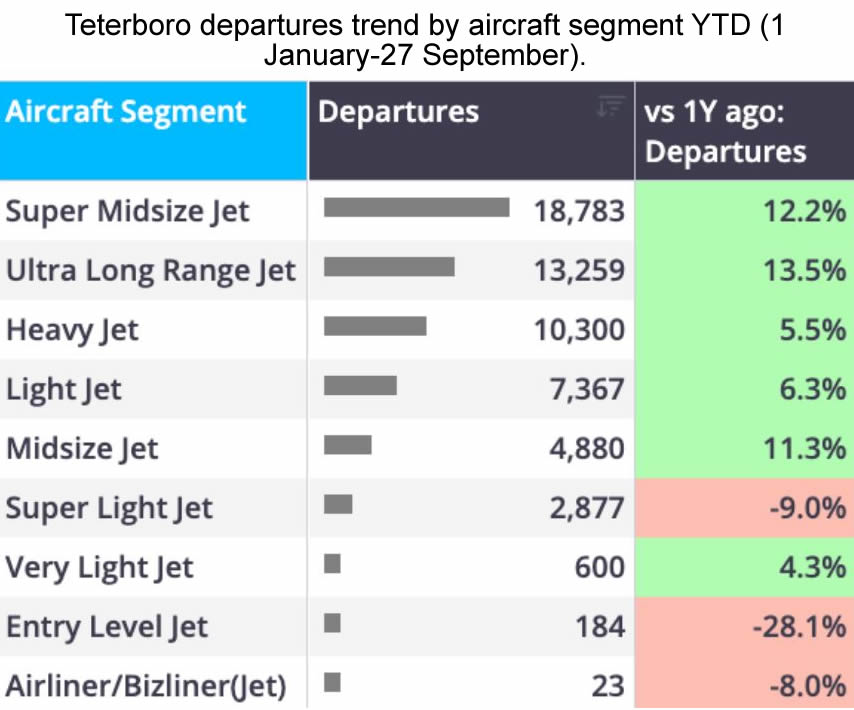
Narrowing down to the region's busiest airport, this table shows the top aircraft segments flying out of Teterboro, YTD. Super Midsize and Ultra Long Range premium cabins lead on volume while also posting the most robust growth, up 12.2% and 13.5%, respectively.
Teterboro departures trend by aircraft segment YTD (1 January-27 September).
click image to enlarge
Europe
European business jet traffic was near flat in Week 39, down 0.7% year-on-year with just over 13,000 flights, and its year-to-date trend now sits at +1.2%. Country-level performance was mixed: Switzerland and France led the top markets, up 7.1% and 7.0% respectively, followed by the UK at +3.5%. In contrast, Germany slipped 1.2% and Italy saw the region's steepest decline among top countries, down 4.8%.
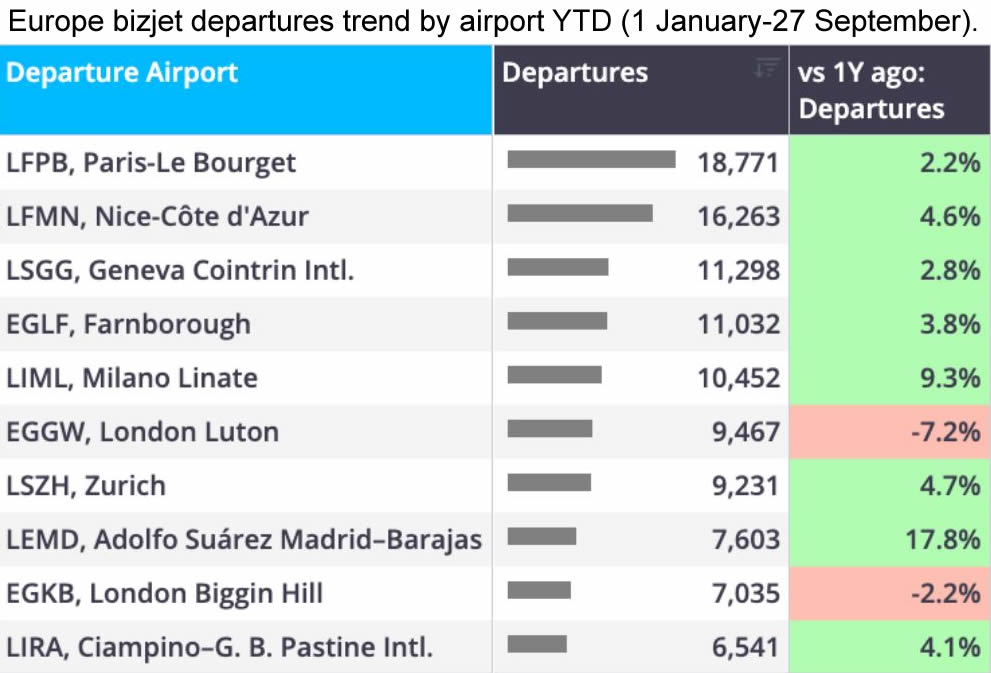
This table ranks Europe's bizjet departures by airport on a year-to-date basis (1 January-27 September), showing both volume and year-on-year change. Flights out of Paris’ Le Bourget lead on volume at more than 18,000 flights, while Madrid’s Adolfo Suárez Madrid-Barajas is posting an exceptional year, up 17.8% compared to 2025 traffic.
Europe bizjet departures trend by airport YTD (1 January-27 September).
click image to enlarge
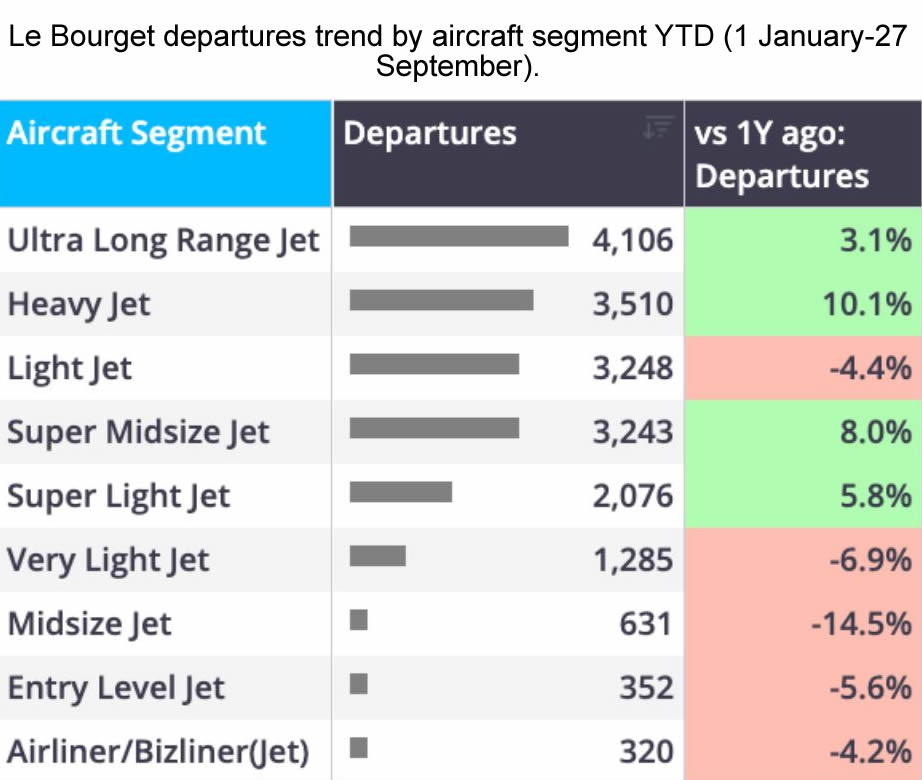
Drilling into flights out of Le Bourget, this table lists Europe's leading aircraft segments flying out of the airport, YTD. Ultra Long Range Jets lead with more than 4,000 flights, while realizing just a modest 3.1% growth, whereas Heavy Jets are leading growth with double-digit gains, +10.1%.
Le Bourget departures trend by aircraft segment YTD (1 January-27 September).
click image to enlarge
Rest of World
Regions outside Europe and North America saw sharply split trends in Week 39. Africa was the standout, up 46.1% (though off a small base), followed by South America's strong +12.6% gain and a modest return to growth in the Middle East at +3.3%. In contrast, Asia declined 4.2% and Australasia & ANZ fell 12.6%, the weakest of the ROW sub-regions.
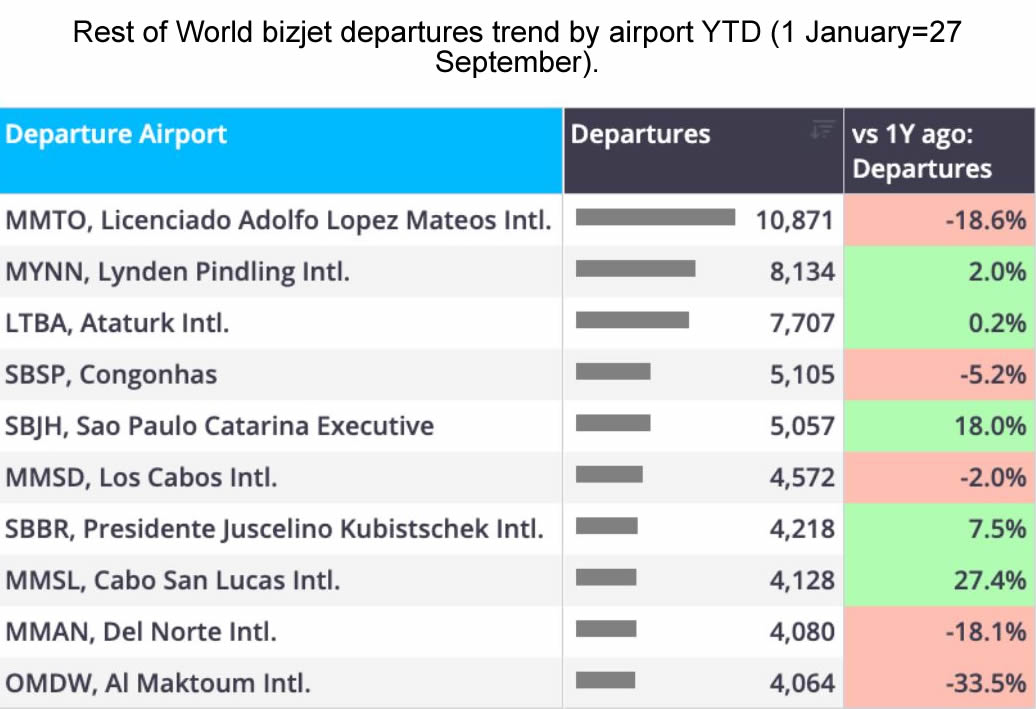
This table ranks bizjet departures outside of North America and Europe by departure airport YTD. Flights from Mexico City’s Licenciado Adolfo Lopez Mateos Intl lead in terms of total flight volume, although these flights are down significantly compared to last year. In contrast, flights out of Cabo San Lucas Intl are seeing 27.4% growth compared to 2025 volume.
Rest of World bizjet departures trend by airport YTD (1 January=27 September).
click image to enlarge
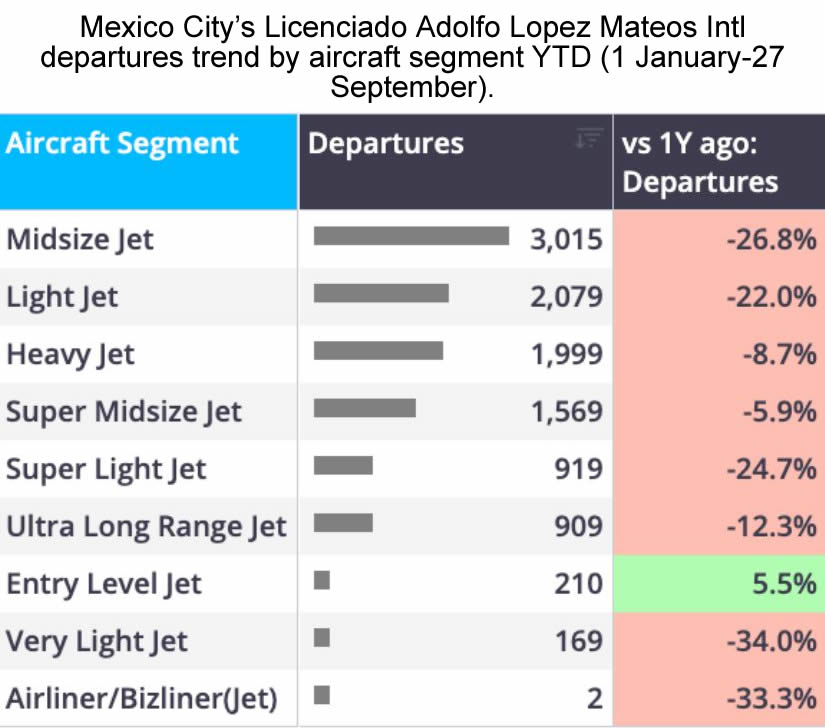
Focusing on the region's top airport, this table shows the aircraft segments flying out of Licenciado Adolfo Lopez Mateos Intl, YTD. Overall, there is broad-based declines across all aircraft segments, except for Entry Level Jets which make up a very small share of total flights from the airport.
Mexico City’s Licenciado Adolfo Lopez Mateos Intl departures trend by aircraft segment YTD (1 January-27 September).
click image to enlarge
Conclusion
Nick Koscinski, WINGX Analyst, comments, “Global activity slipped about 1% last week, so after a couple of flat weeks we've had a small step down, though the year-todate trend is still holding up at +3.4%.
"Africa was the standout again at +46%, but that's off a small base, so I would take it simply as a strong week. With key states Florida and Texas both up on the week, I'm not reading too much into North America's slight dip.”
This bulletin is produced by WINGX, part of the JETNET Group. The JETNET Group is an independent organisation with no commercial affiliation with BlueSky News. All references to products, services, and events in this bulletin are editorial in nature and have not been paid for or sponsored by any third party.



“Global activity slipped about 1% last week, so after a couple of flat weeks we've had a small step down, though the year-todate trend is still holding up at +3.4%.
"Africa was the standout again at +46%, but that's off a small base, so I would take it simply as a strong week. With key states Florida and Texas both up on the week, I'm not reading too much into North America's slight dip.”
Nick Koscinski
WINGX Analyst.
WINGX GmbH
Lilienstraße 11
20095 Hamburg
Germany.
+49 40 23 96 85 05
BlueSky Business Aviation News | 1st October 2026 | Issue #860

| © BlueSky Business Aviation News Ltd 2008-2026 |