


WINGX Global Market Tracker:
Global bizjet activity flat, Mideast still in doldrums
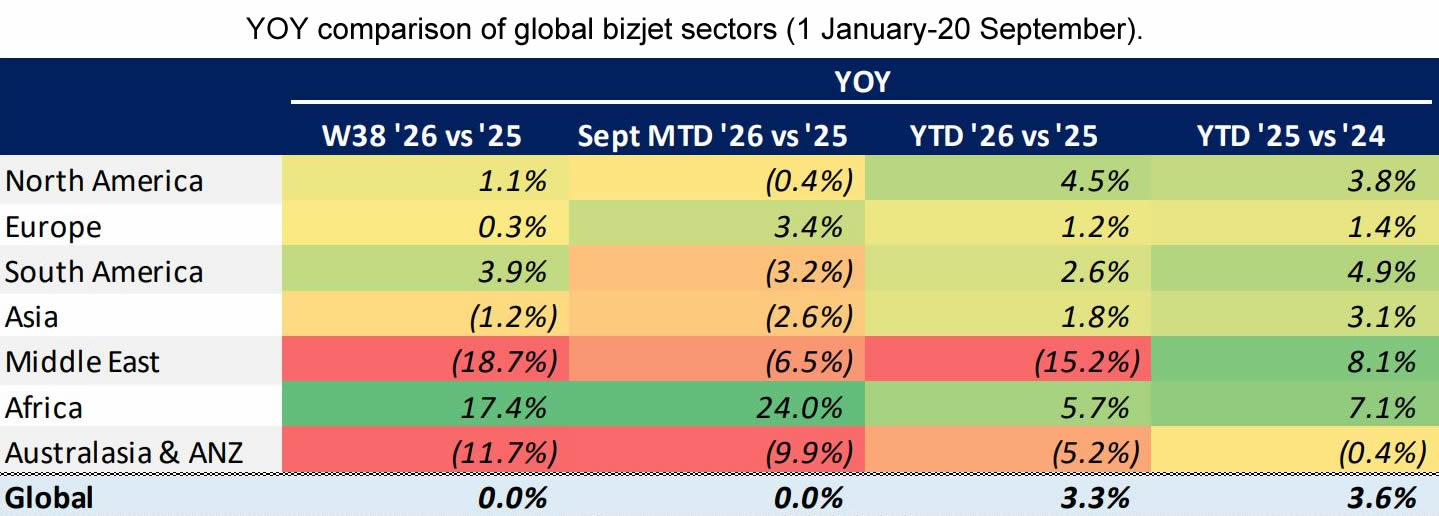
Global bizjet activity saw a 2nd consecutive week of flat activity in Week 38 (14-20 Sept), with the year-to-date figure at +3.3% ahead of last year through 20 September, now 0.3 percentage points below the comparable growth trend for the same dates in 2025 vs 2024.
The Middle East region continues to see significant declines compared to last year. Notably, bizjet demand is also well down in Australasia & ANZ. While accounting for only 1.2% of global bizjet traffic last week, Africa realized the most notable growth, up 17.4%.
YOY comparison of global bizjet sectors (1 January-20 September).
click image to enlarge
Regional Performance Analysis in Week 38
North America
The North American market outperformed the global market last week, demand for flights growing 1.1% year-on-year. Weekly year-on-year regional growth was variable, with bizjet flights from airports in Texas up 4.8%, California down 1.4%, and Florida down 3.1%.
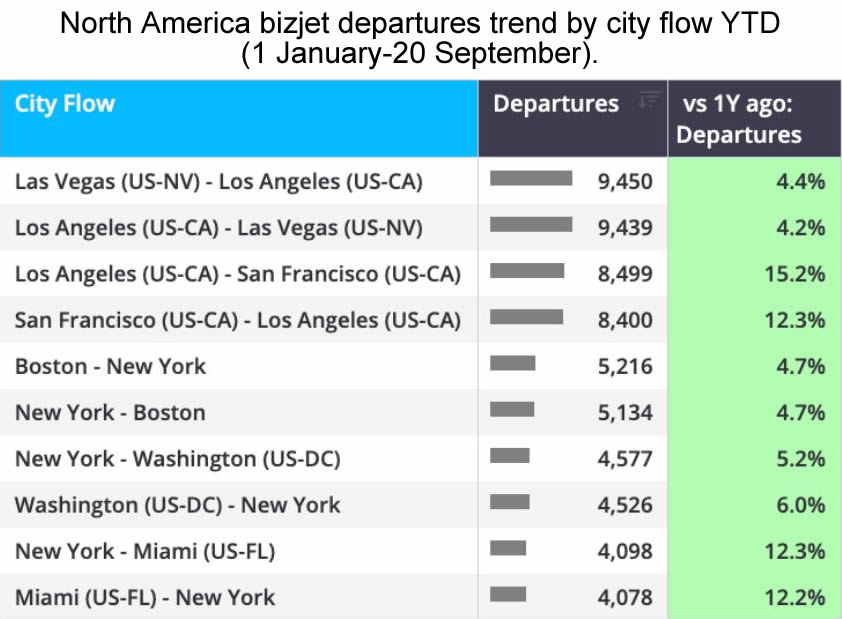
The below table ranks North America's bizjet departures by city (airports aggregated to metropolitan hubs) flow on a year-to-date basis (1 January-20 September), showing both volume and year-on-year change. Amongst top routes, the Las Vegas and Los Angeles corridor leads on volume, whereas the Los Angeles and San Francisco corridor leads in growth.
North America bizjet departures trend by city flow YTD (1 January-20 September).
click image to enlarge
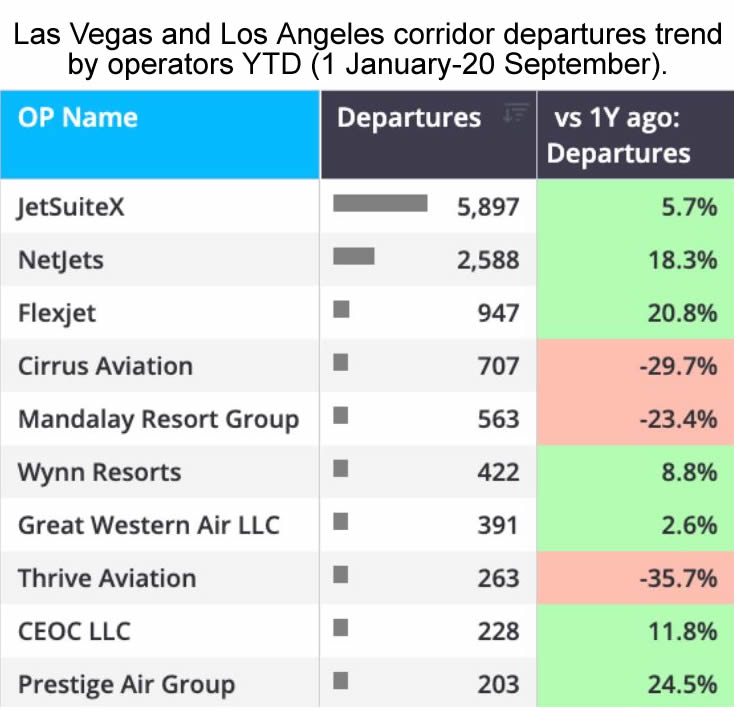
Narrowing down to the region's busiest corridor, this table shows the top operators flying between Las Vegas and Los Angeles, YTD. Charter company JetSuiteX leads amongst top fleet operators on this route, 5.7% busier on this corridor compared to last year. Notably, leading fractional operators NetJets and Flexjet are both seeing robust double-digit year-on-year growth on this route.
Las Vegas and Los Angeles corridor departures trend by operators YTD (1 January-20 September).
click image to enlarge
Europe
In Week 38, Europe’s business jet traffic growth was flat YOY at just 0.3% growth, while its YTD trend is now +1.2%, while growth on a top country level was a mixed bag. The UK was farthest ahead of Week 38 2025 bizjet traffic, expanding 3.7%, trailed by Italy up 2.9%, while all other top countries saw declines to varying degrees. Airports in France saw 2.8% less traffic, Switzerland was down 5.7%, with bizjet traffic in Germany down by 7.2%.
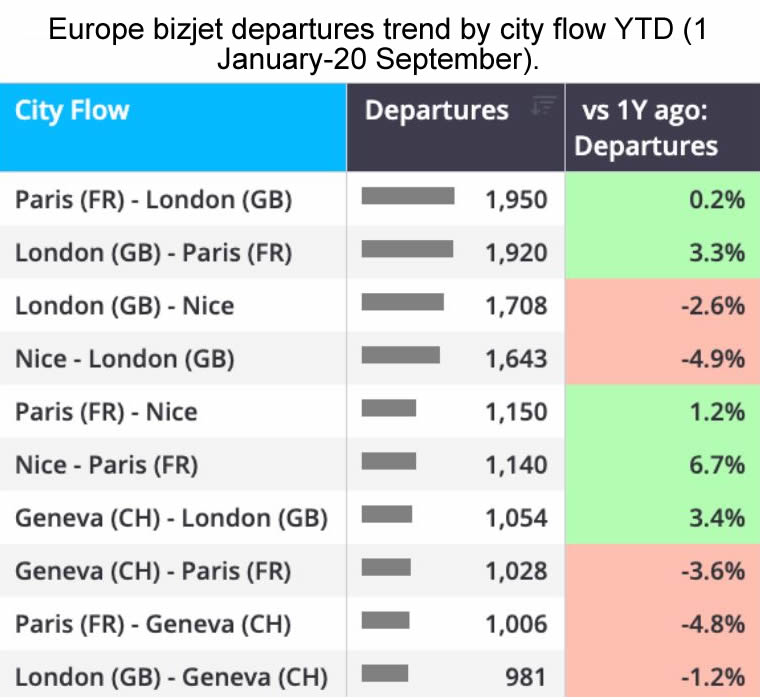
This table ranks Europe's bizjet departures by city flow on a year-to-date basis (1 January-20 September), showing both volume and year-on-year change. Flights between Paris and London lead on volume at nearly 4,000 flights between the two hubs, while the 2nd top corridor between London and Nice is seeing a drop-off in flights compared to last year.
Europe bizjet departures trend by city flow YTD (1 January-20 September).
click image to enlarge
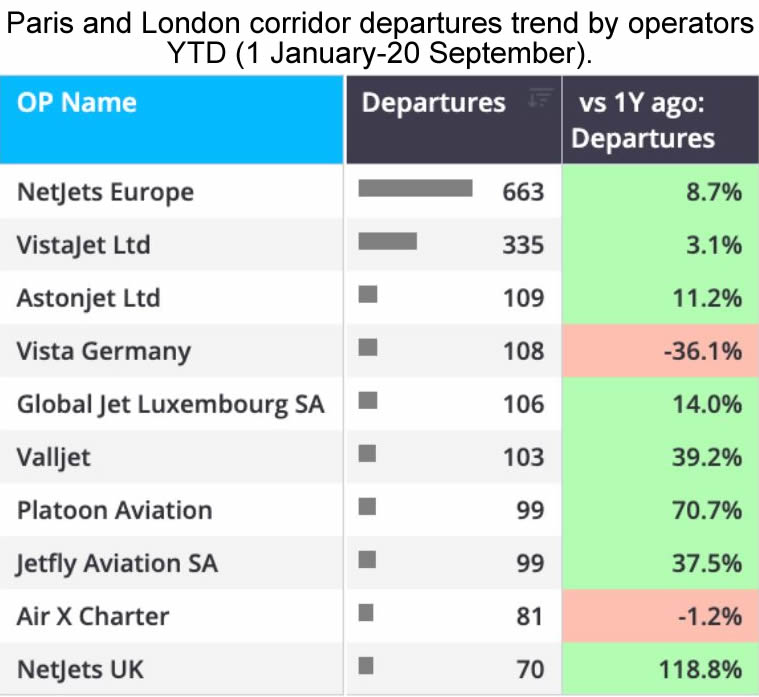
Drilling into flights between Paris and London, this table lists Europe's leading operators flying that route, YTD. NetJets Europe dominates with more than 600 flights, roughly double its nearest competitor, VistaJet, while growing fleet operator Platoon Aviation seeing notable growth on this route.
Paris and London corridor departures trend by operators YTD (1 January-20 September).
click image to enlarge
Rest of the World
Business jet activity in regions outside of Europe and North America declined 6.5% on a combined basis in Week 38, with split trends on a sub-region basis. Africa was the star performer last week, up 17.4%, while South America saw a modest 3.9% gain. In contrast, the Middle East was down 18.7%, Asia down 1.2%, and Australasia & ANZ was down 11.7%.
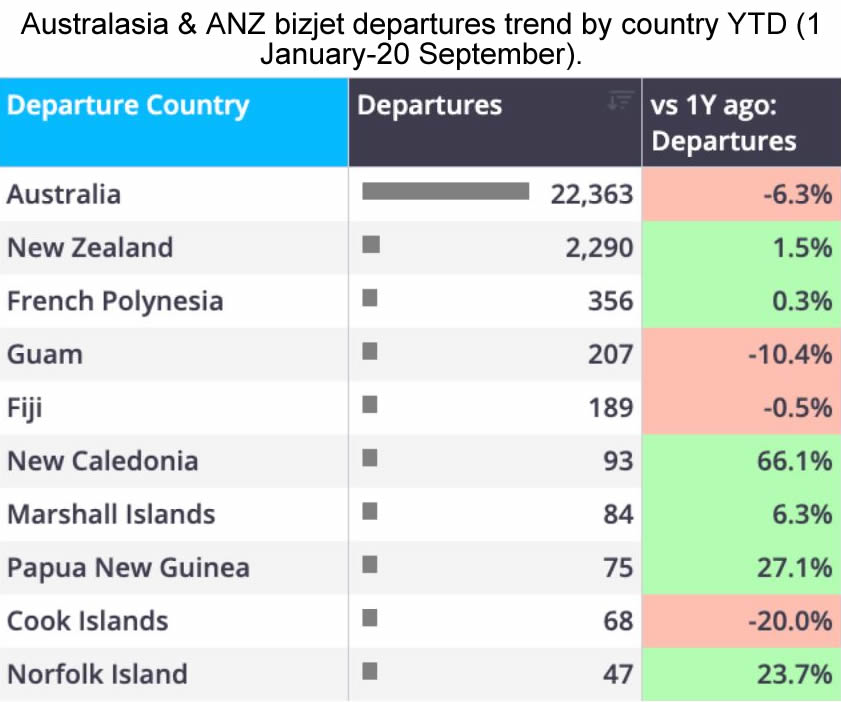
Outside of the Middle East’s decline, which is attributed to the US-Israel-Iran conflict, the most notable Rest of World region decline is in Australasia & ANZ. This decline is being driven by Australia, which accounts for 85.8% of the region’s business jet traffic, while down 6.3% year-to-date, meaning the Australia decline is responsible for essentially all of the region’s 5.2% year-to-date overall decline.
Australasia & ANZ bizjet departures trend by country YTD (1 January-20 September).
click image to enlarge
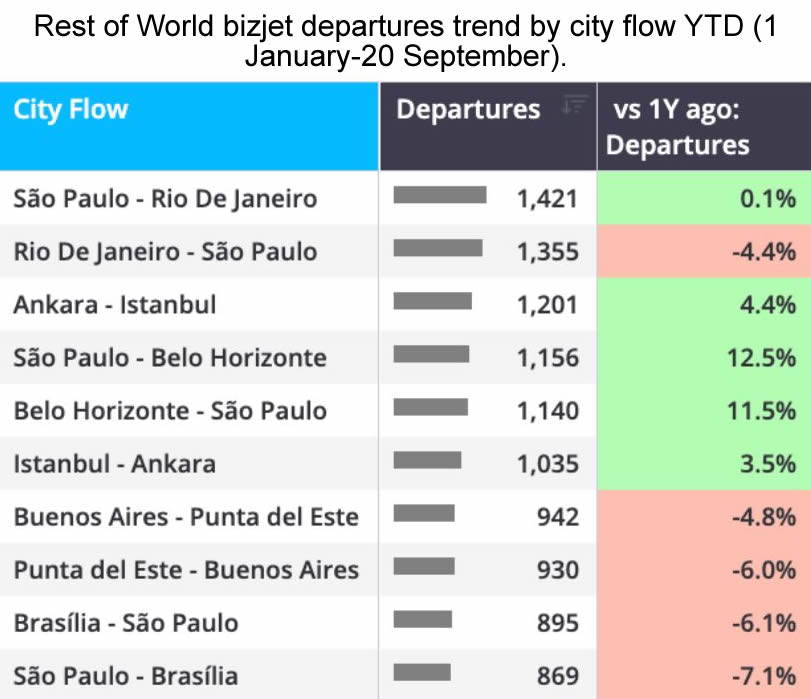
This table ranks bizjet departures outside of North America and Europe by city flows YTD. Flights between São Paulo and Rio De Janeiro lead in terms of total flight volume, while flights between São Paulo and Belo Horizonte lead in terms of growth compared to last year.
Rest of World bizjet departures trend by city flow YTD (1 January-20 September).
click image to enlarge
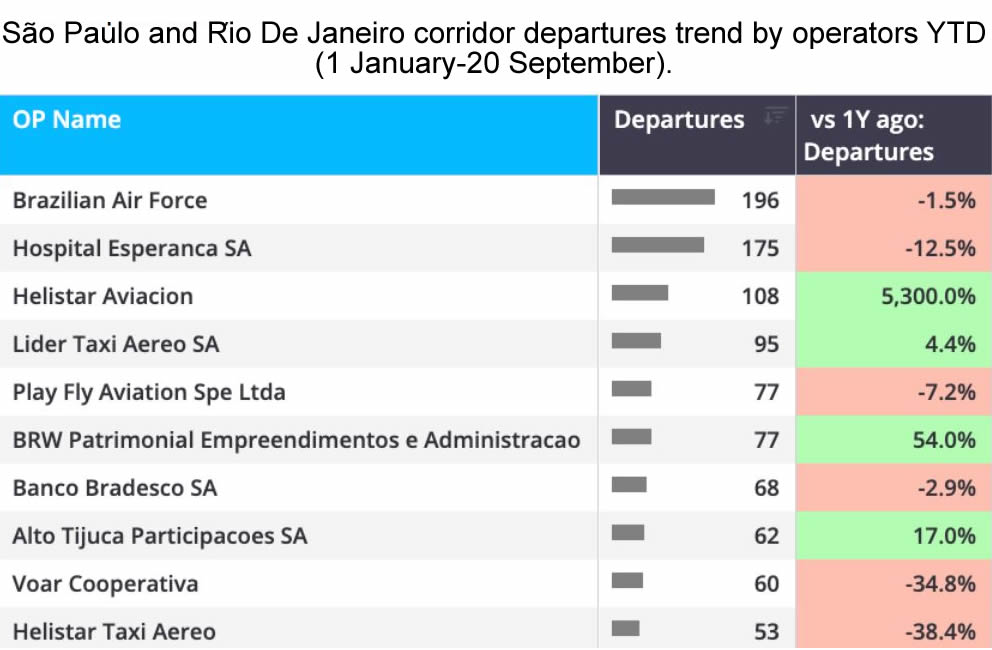
Focusing on the region's top corridor, this table shows the top operators flying the São Paulo and Rio De Janeiro corridor, YTD. Government operator, the Brazilian Air Force, leads this corridor at nearly 200 flights so far this year, while Helistar Aviacion is leading in terms of growth, although this standout growth is due to almost no flying on this route last year by Helistar.
São Paulo and Rio De Janeiro corridor departures trend by operators YTD (1 January-20 September).
click image to enlarge
Conclusion
Nick Koscinski, WINGX Analyst, comments, “Global bizjet activity was flat for a second straight week, with the year-to-date figure sliding to +3.3%, a touch behind where we were at this point last year.
"The most notable growth remains in the emerging bizjet markets with Africa up 17.4% last week. The bulk of the market is very much in the US, with fractional operators still seeing lots of growth even if overall flight activity growth has recently stalled.”
This bulletin is produced by WINGX, part of the JETNET Group. The JETNET Group is an independent organisation with no commercial affiliation with BlueSky News. All references to products, services, and events in this bulletin are editorial in nature and have not been paid for or sponsored by any third party.



“Global bizjet activity was flat for a second straight week, with the year-to-date figure sliding to +3.3%, a touch behind where we were at this point last year.
"The most notable growth remains in the emerging bizjet markets with Africa up 17.4% last week. The bulk of the market is very much in the US, with fractional operators still seeing lots of growth even if overall flight activity growth has recently stalled.”
Nick Koscinski
WINGX Analyst.
WINGX GmbH
Lilienstraße 11
20095 Hamburg
Germany.
+49 40 23 96 85 05
BlueSky Business Aviation News | 24th September 2026 | Issue #859

| © BlueSky Business Aviation News Ltd 2008-2026 |