


WINGX Global Market Tracker:
Mideast posts rare weekly gains as global bizjet traffic growth now matches
last year
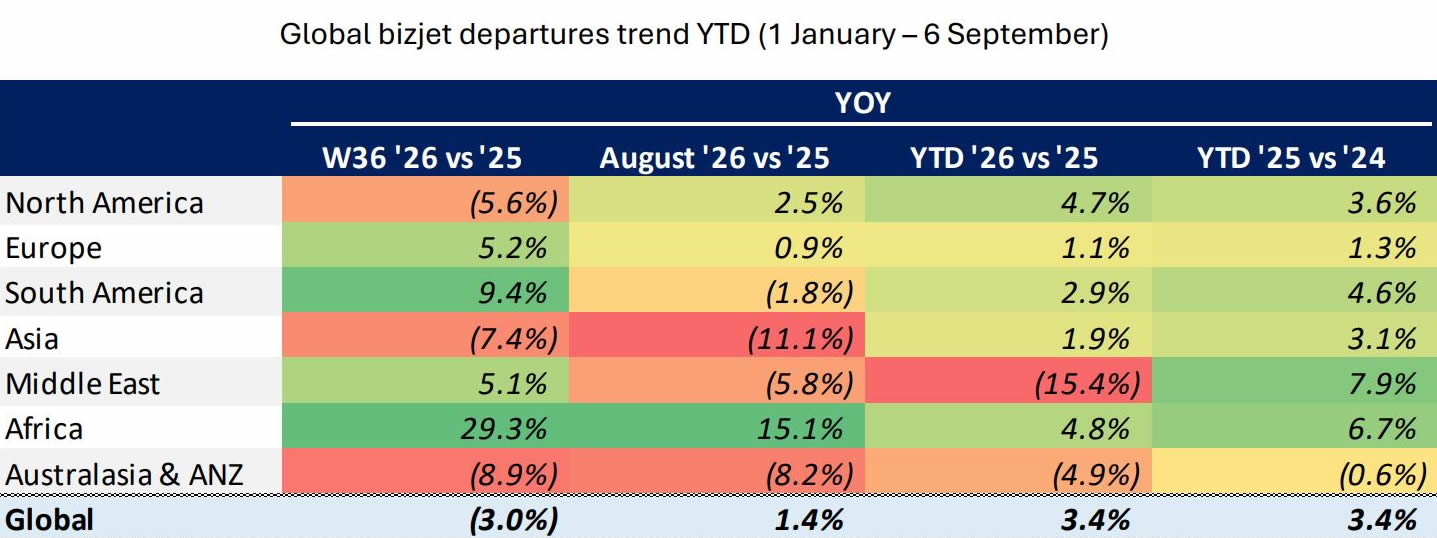
Global bizjet activity contracted 3.0% in Week 36 (31 Aug-6 Sept), with the year-todate figure at +3.4% ahead of last year through 6 September, now matching the trend for the same dates in 2025 vs 2024.
North America notably declined 5.6% last week, although this is most likely due to when Labor Day weekend fell this year vs last, while the Middle East experienced a 5.1% gain compared to Week 36 2025, just the 6th time the Mideast region has seen weekly YOY gains this year, and just the 2nd instance of weekly year-on-year growth since the US-Israel-Iran conflict kicked off in Week 9.
Global bizjet departures trend YTD (1 January-6 September).
click image to enlarge
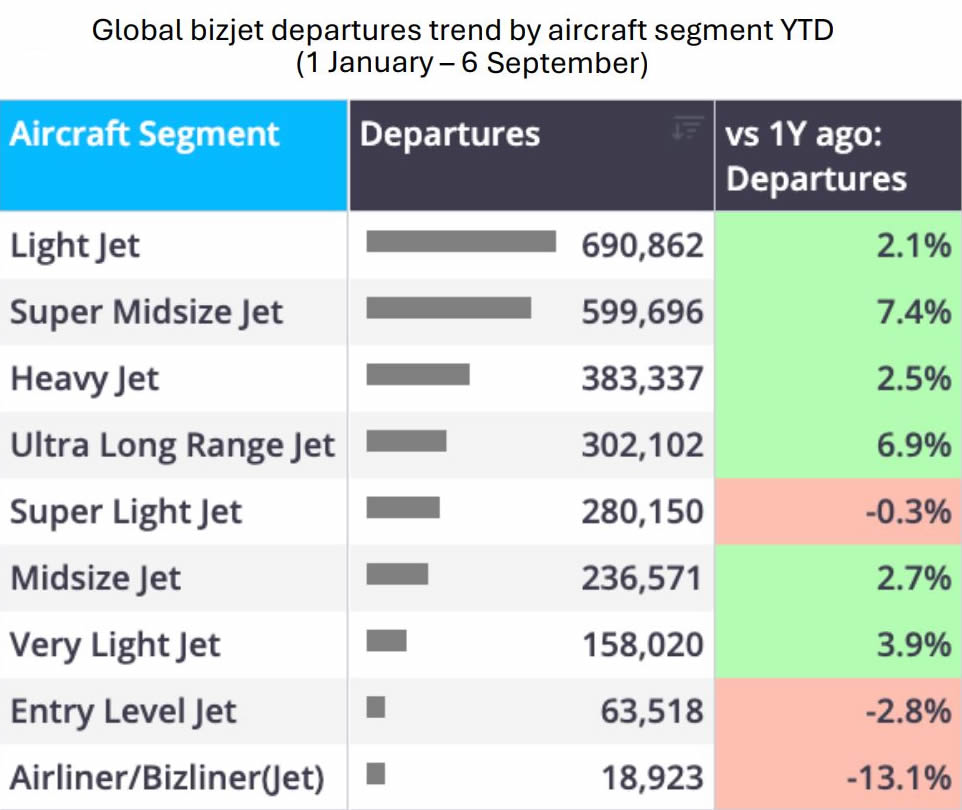
Through 6 September, global bizjet growth has been powered by the large-cabin end of the market, with Super Midsize (+7.4%, 599,696 departures) and Ultra Long Range (+6.9%, 302,102 departures) posting the strongest year-on-year gains. Light Jets remain the busiest overall at 690,862 departures, while up just 2.1%. In contrast, older segments like the Super Light and Entry Level Jets are seeing some year-on-year declines.
Global bizjet departures trend by aircraft segment YTD (1 January-6 September).
click image to enlarge
Regional Performance Analysis in Week 36
North America
The North American market underperformed the global market contracting 5.6% last week year-on-year, with the US almost matching this trend at -5.4%. All three key US states also declined last week, with Texas down 2.9%, California contracting 3.5%, and Florida declining 5.8%.
However, this North American 5.6% contraction is most likely due to Labor Day holiday timing in the US and Canada rather than any sort of fall in demand. The holiday typically causes activity to soften compared to non-holiday weeks, as bizav consumers spend the long weekend with family rather than travelling.
This year, Labor Day landed on 7 September, placing the quiet pre-holiday weekend on 5-6 September inside Week 36. Last year, Labor Day fell a week earlier, on 1 September, so the quiet weekend of 30-31 August fell in Week 35. Essentially, this week we are comparing a Labor Day weekend lull in Week 36 2026, to a non-Labor Day weekend lull in Week 36 2025.
If we were to align the Labor Day holiday weekends, 2026 was actually up 2.5% compared to 2025.
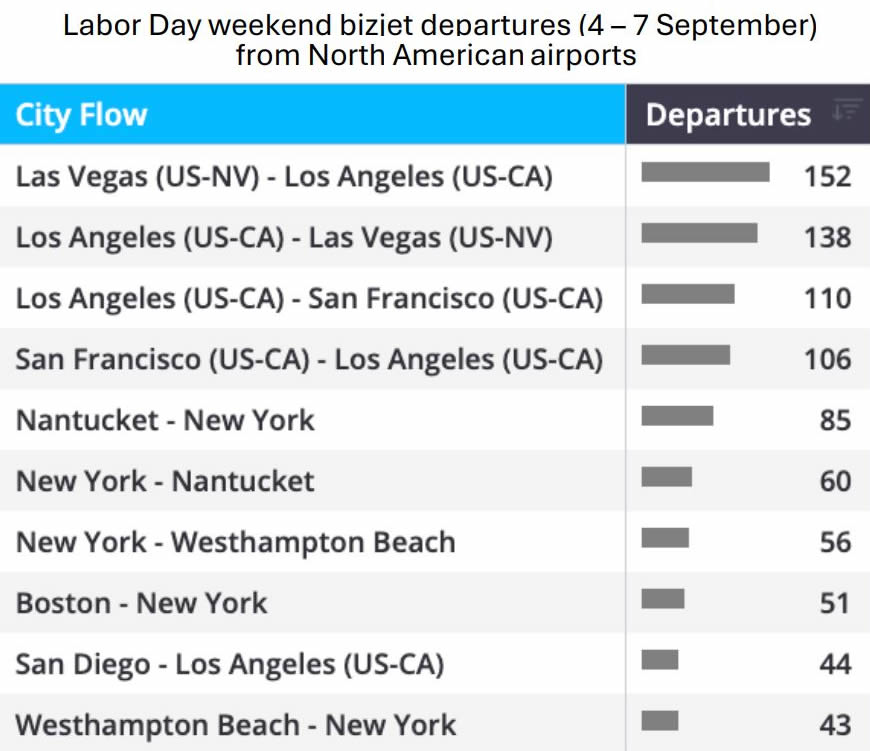
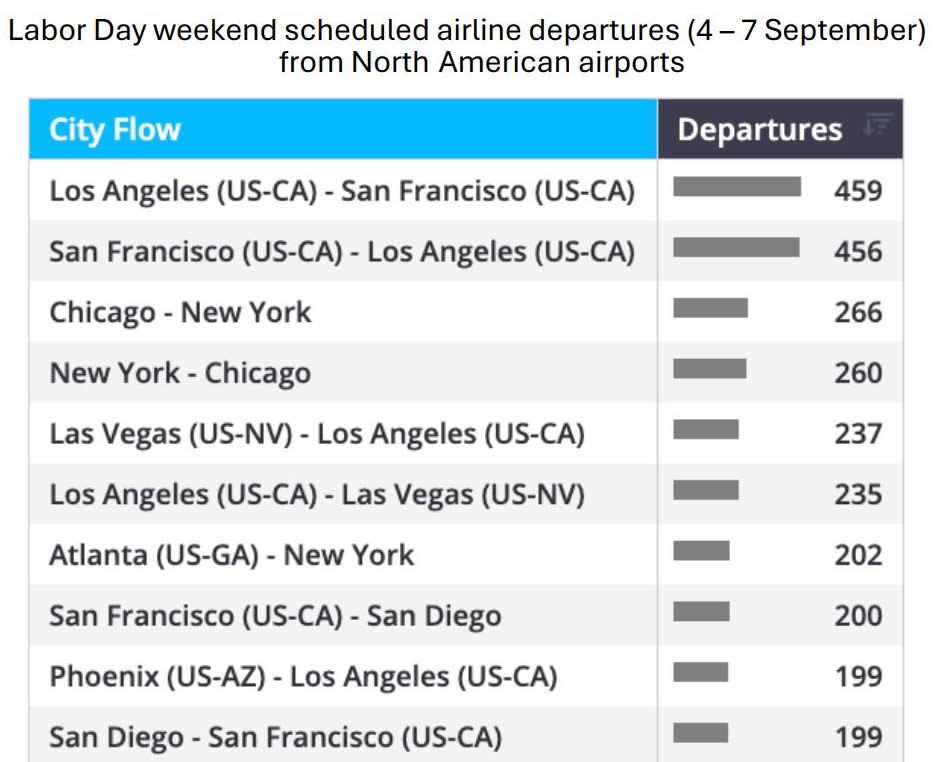
The below tables show the contrast in top Labor Day weekend city pairs between business jets and scheduled airlines. While both market sectors share the Los Angeles - San Francisco and Las Vegas - Los Angeles corridors, business jets primarily focus on second-home locations over the holidays, while airlines continue to run their typical top routes.
Labor Day weekend bizjet departures (4-7 September) from North American airports.
click images to enlarge
Labor Day weekend scheduled airline departures (4-7 September) from North American airports.
Top FBO Case Study: Atlantic vs Signature Footprint
Our bulletin last week measured Apollo’s recent investment Atlantic Aviation’s overall footprint, where there were over 595,000 business jet departures through 30 August from airports where Atlantic runs an FBO, with these departures up 5.8% vs last year and accounting for 1/3 of all US business jet departures. This week we compare that footprint to its largest competitor: Signature Aviation.
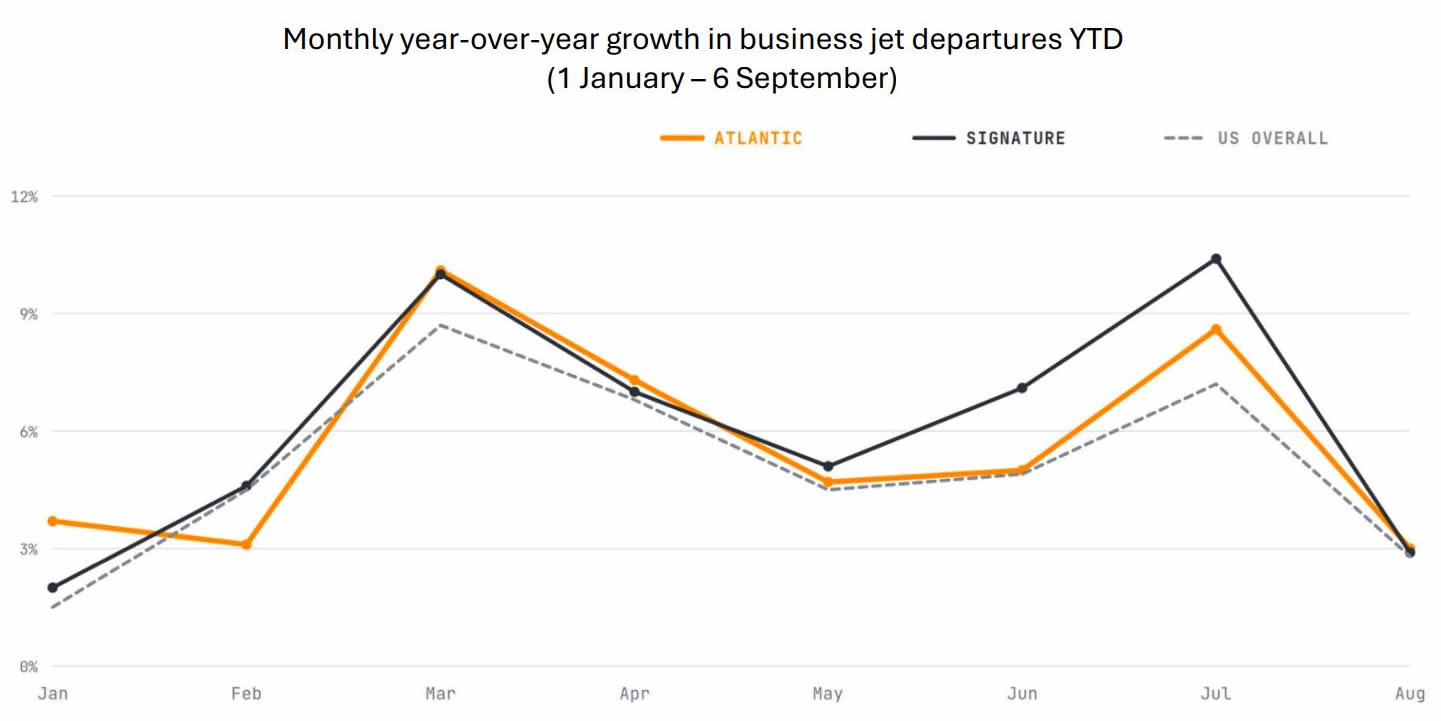
During the 1 January-6 September period, Atlantic’s network saw roughly 649,000 business jet departures, which accounted for 34.7% of all US business jet departures. Signature’s network reaches a similar share of US traffic, with 655,000 bizjet departures accounting for 35.0% share of US activity, while also focusing on the largest US metros.
Both networks are also growing faster than the overall US market. Departures from airports where Atlantic has an FBO in the US rose 5.5% compared to the 1 January-6 September period last year, while departures from Signature’s network grew 5.9%, all compared to the overall US growth of 5.0%.
Monthly year-over-year growth in business jet departures YTD (1 January-6 September).
click image to enlarge
Europe
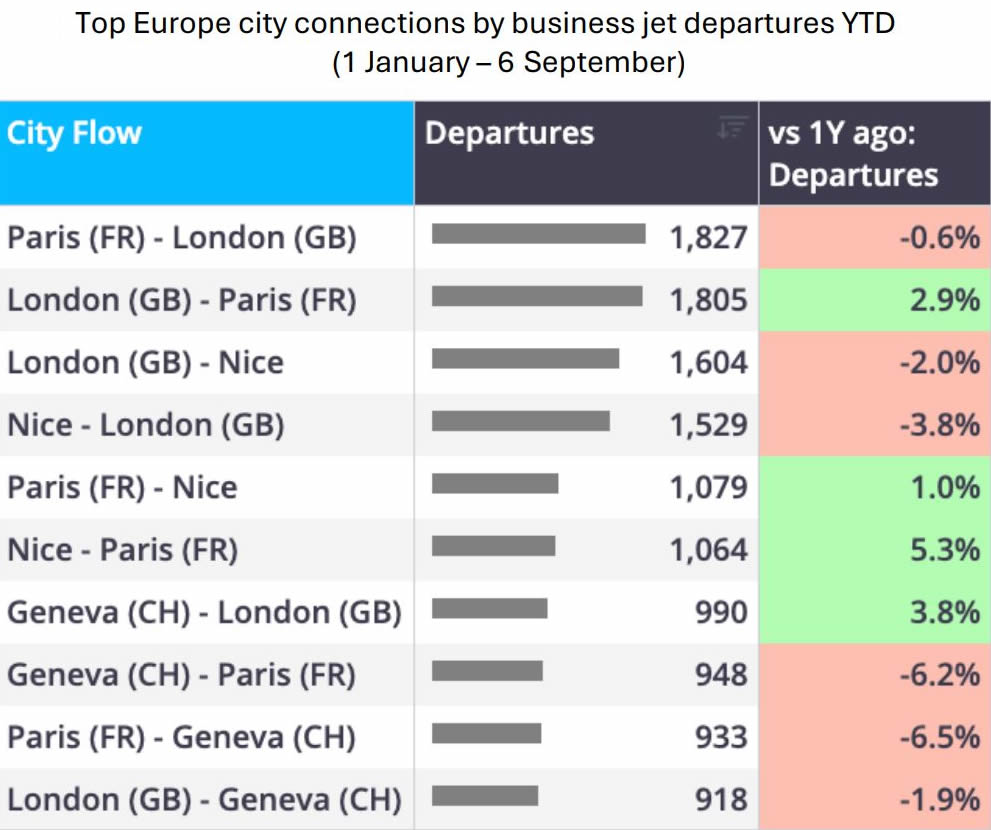
In Week 36, Europe’s business jet traffic expanded 5.2% vs last year, although its YTD trend sits at a muted +1.1%, while all top countries saw year-on-year gains last week across Europe. Italy and the UK were the standout performers last week, gaining 12.2% and 10.2% respectively, followed by Switzerland’s 6.8% growth, with Germany at 1.2%, and finally with airports in France relatively flat at just 0.7% growth.
Top Europe city connections by business jet departures YTD (1 January-6 September).
click image to enlarge
Rest of World
Business jet activity in regions outside of Europe and North America expanded 5.3% on a combined basis in Week 36, Australasia & ANZ and Asia being the only regions with declines, falling 8.9% and 7.4%, respectively, compared to Week 36 2025.
In contrast, Africa saw double-digit gains of 29.3%, continuing its strong trend seen in recent weeks, while South America expanded 9.4%, and the Middle East grew 5.1%.
The Middle East growth was primarily driven by Turkey, due to growth in the latesummer resort airports of Bodrum, Dalaman, and Antalya, alongside the Istanbul and Ankara hubs. However, Gulf airports were still down overall, so last week the Mideast’s growth seems to be just a blip carried by Turkey, rather than any recovery trajectory.
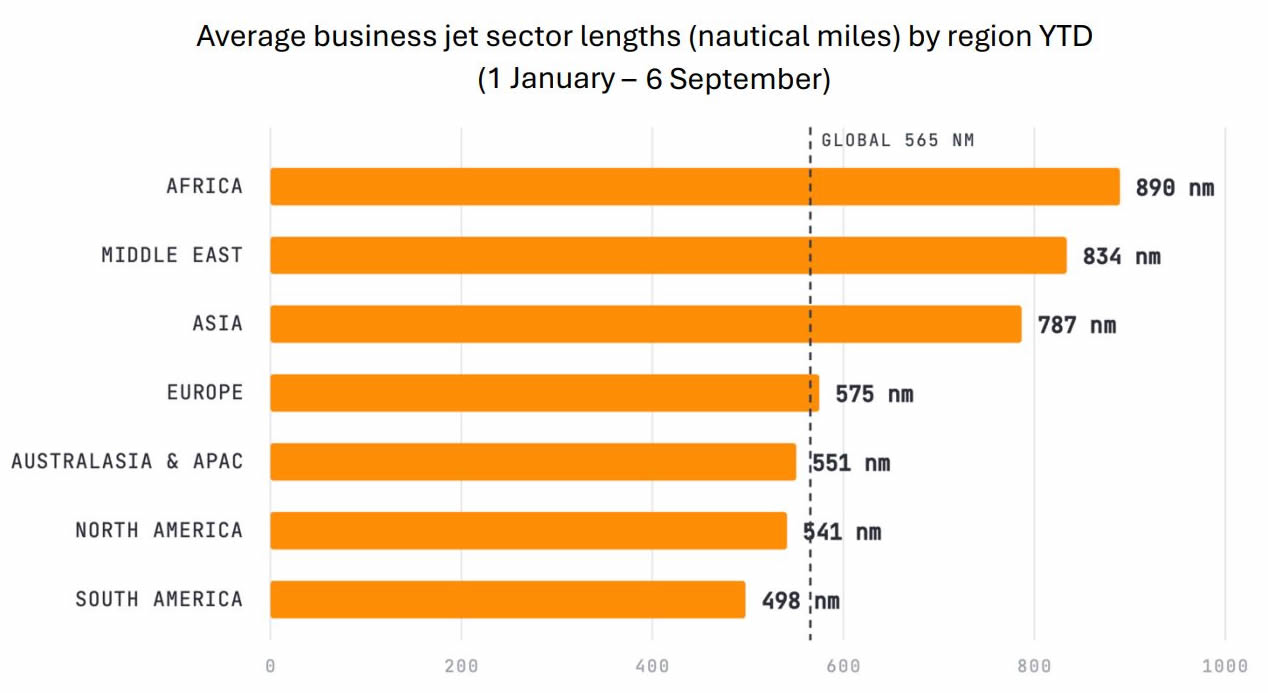
Across the 1 January-6 September period, global business jet sector lengths averaged at 565 nautical miles, with average sector lengths varying greatly by region. Africa averaged the longest sectors at 890 nm, followed by the Middle East 834 nm, and Asia at 787 nm, all well above the global average. North America averaged just 541 nm and South America just 498 nm, with Europe at 575 nm sitting closer to the global average.
This general trend highlights that in emerging markets such as Africa, the Middle East, and Asia, airport networks are not as robust as in North America and Europe, and longer point-to-point flying is necessary.
Average business jet sector lengths (nautical miles) by region YTD (1 January-6 September).
click image to enlarge
Conclusion
Nick Koscinski, WINGX Analyst, comments, “North America’s 5.6% contraction last week seems significant, however that is entirely due to when the Labor Day holiday fell this year vs last. In fact, Labor Day weekend this year was up 2.5% compared to Labor Day weekend last year.
"Instead, the most notable regional trend last week was the Middle East posting 5.1% YOY growth, just the second weekly gain since the conflict began earlier this year, although still down heavily year-to-date.”
This bulletin is produced by WINGX, part of the JETNET Group. The JETNET Group is an independent organisation with no commercial affiliation with BlueSky News. All references to products, services, and events in this bulletin are editorial in nature and have not been paid for or sponsored by any third party.



“North America’s 5.6% contraction last week seems significant, however that is entirely due to when the Labor Day holiday fell this year vs last. In fact, Labor Day weekend this year was up 2.5% compared to Labor Day weekend last year.
"Instead, the most notable regional trend last week was the Middle East posting 5.1% YOY growth, just the second weekly gain since the conflict began earlier this year, although still down heavily year-to-date.”
Nick Koscinski
WINGX Analyst.
WINGX GmbH
Lilienstraße 11
20095 Hamburg
Germany.
+49 40 23 96 85 05
BlueSky Business Aviation News | 10th September 2026 | Issue #857

| © BlueSky Business Aviation News Ltd 2008-2026 |