


WINGX Global Market Tracker:
Global bizjets still up 3.5% on the year after a sluggish August
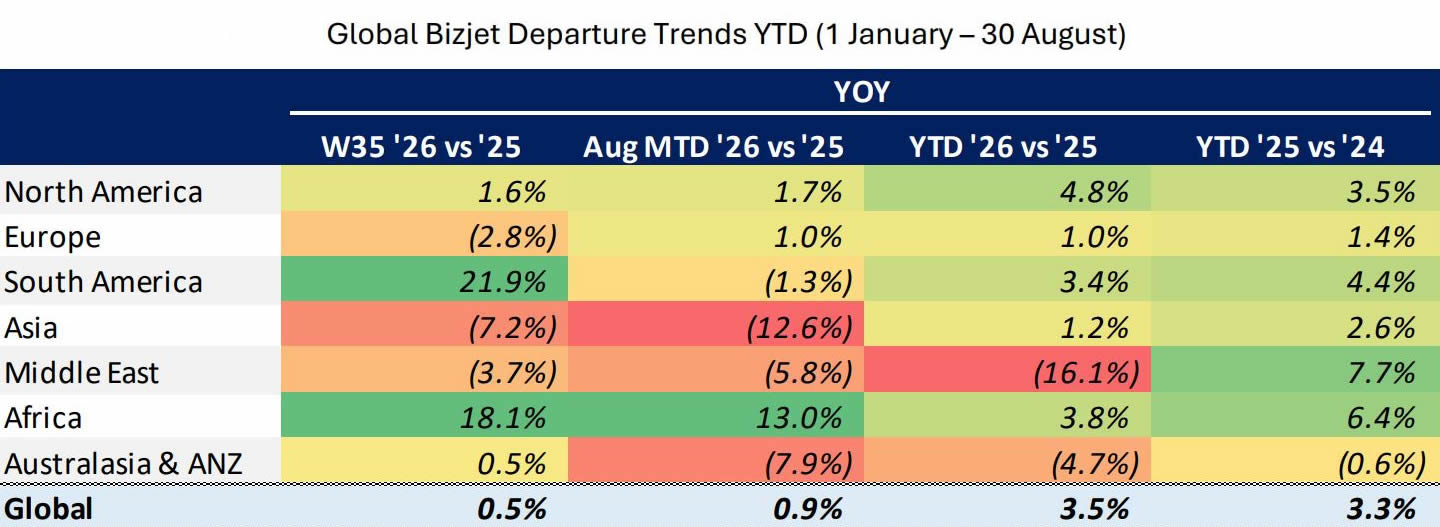
Global bizjet activity was relatively flat in Week 35 (24-30 August), just 0.5% more traffic than in Week 35 2025, with the year-to-date figure at +3.5% ahead of last year through 30 August, just a 0.2 percentage point increase compared to the trend for the same dates in 2025 vs 2024.
For the third consecutive week, Asia stood out as the region with the largest declines, down 7.2% while accounting for 3% of global activity. In contrast, airports in South America and Africa both realized double digit gains, up 21.9% and 18.1%, respectively.
Global Bizjet Departure Trends YTD (1 January-30 August).
click image to enlarge
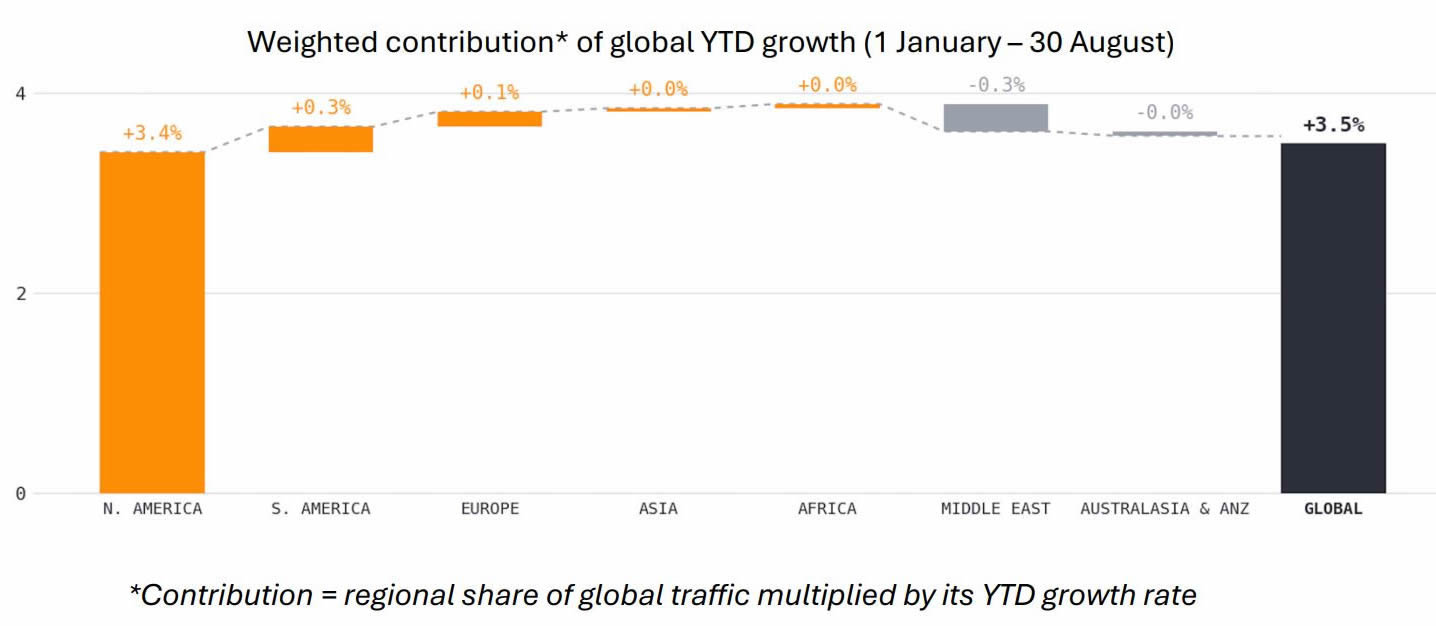
The waterfall chart below breaks down the global +3.5% YTD growth trend in business jet departures into each region’s weighted contribution (its share of traffic multiplied by its YTD growth rate).
North America, at 71.1% of all activity and up 4.8% accounts for +3.4 points of that gain, continuing to serve as the global growth engine for bizjet traffic. While accounting for 7.5% of global bizjet traffic this year, South America’s 3.4% yearto-date expansion offsets the Middle East’s 16.1% decline, while the Mideast made up just 1.7% of global activity.
Weighted contribution* of global YTD growth (1 January-30 August).
click image to enlarge
Looking into how hard the global fleet is working, business jets flew an average of 167 hours per aircraft year-to-date through 30 August, up 1.1% on the same period last year. With total hours up 4.2% and fleet growth of 3.1%, reflecting each aircraft doing modestly more flying than a year ago.
On an operator basis, the large fleet operators remain the ones with the heaviest utilised aircraft, with NetJets at 606 hours per aircraft (up 1.7% vs YTD 2025), followed by Flexjet at 581 hours per unit (down 0.8%), and Vista
Global at 572 hours (up 3.3%), with each flying its fleet roughly 3.5x the global average. FlyExclusive posted standout utilisation growth amongst top operators, with 493 hours per unit, up 19.7%, as the operator flew a smaller fleet while increasing hours compared to last year.
Regional Performance Analysis in Week 35
North America
The North American market outperformed the global market at +1.6% last week yearon-year, with the US performing broadly in line with the region at +1.4%. On a key state basis, airports in California saw 1.9% growth in bizjet flight activity vs Week 35 2025, while activity in Texas contracted 0.3%, and Florida declined 0.8%.
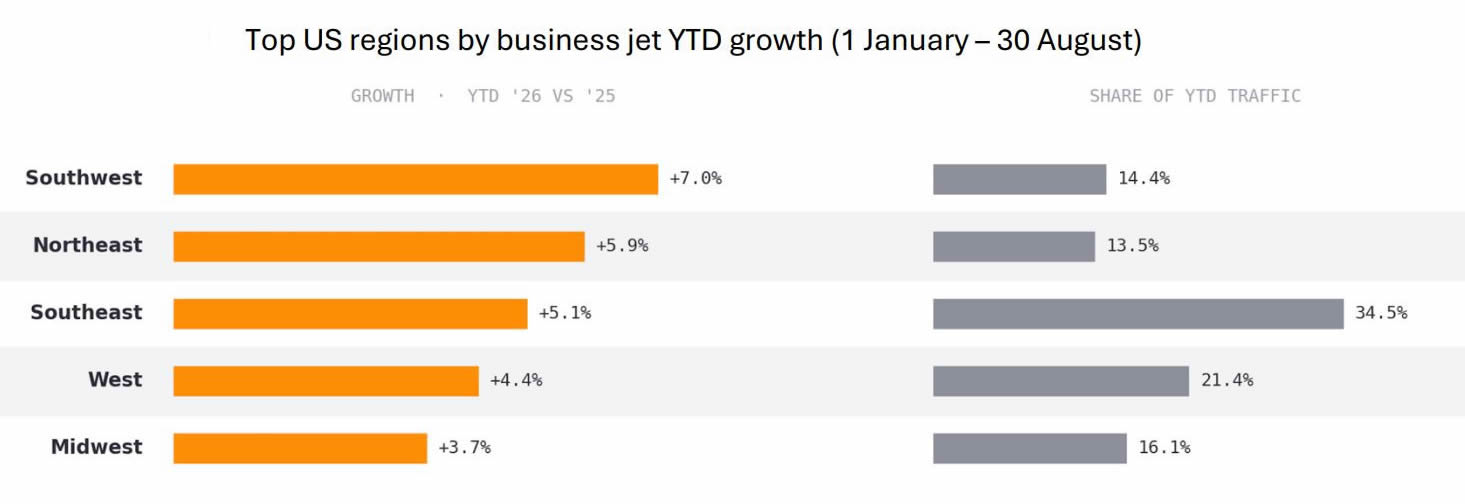
The ranking chart below shows the fastest growing US regions by year-to-date business jet departures, alongside each region’s share of total US traffic. The Southwest region leads growth so far this year, while accounting for 14.4% of US activity. The Southeast accounts for the most US traffic by a large margin, while up 5.1% through 30 August this
year.
Top US regions by business jet YTD growth (1 January-30 August).
click image to enlarge
Atlantic Aviation Case Study
On 27 August 2026, Apollo-managed funds bought a significant stake in Atlantic Aviation, valuing one of the largest FBO networks in the US at roughly $10 billion. KKR, which has owned Atlantic since 2021, stays on as a substantial shareholder, marking the beginning of the partnership between Apollo and KKR, rather than an exit by KKR.
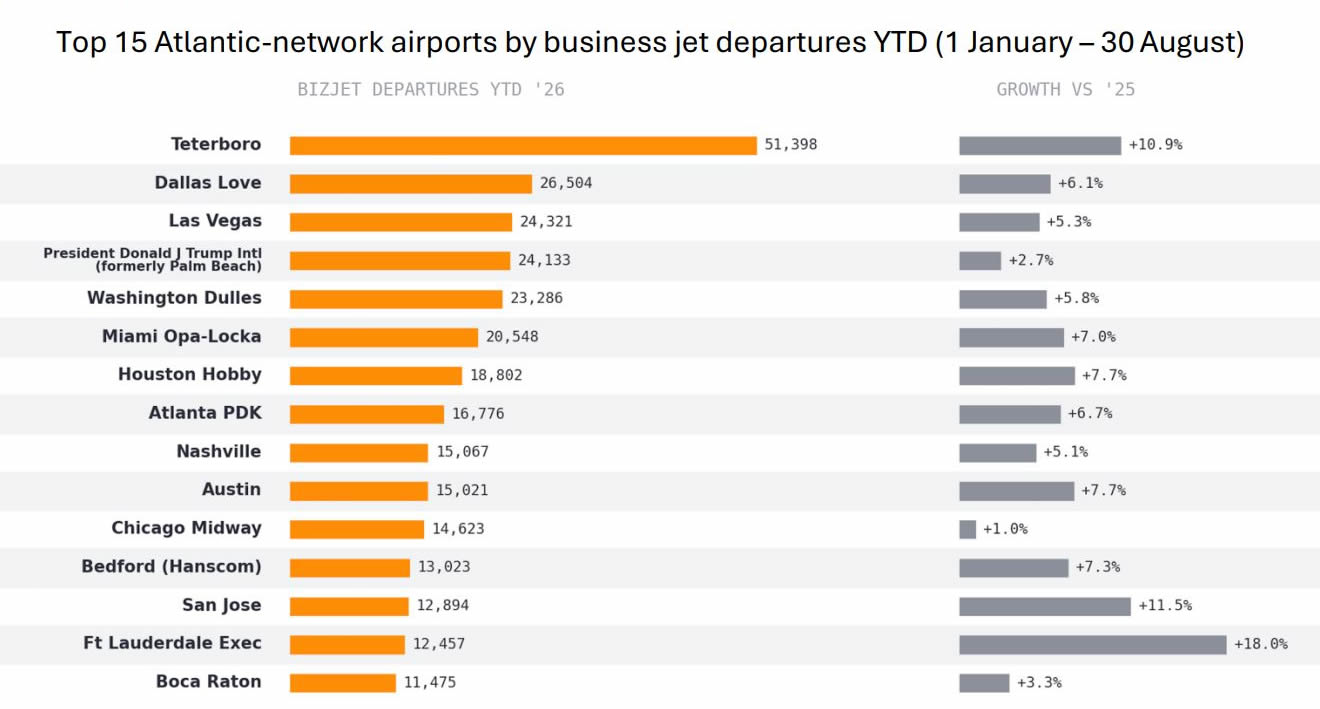
Across the US airports where Atlantic runs an FBO, business jet departures hit over 595,000 between 1 January and 30 August this year, up 5.8% year on year and a little ahead of the 5.0% growth in the US market overall. Those 595,000 departures make up 1/3 of all US business jet departures, while Atlantic is also on the field at 18 of the 30 busiest bizjet airports in the US.
Top 15 Atlantic-network airports by business jet departures YTD (1 January-30 August).
click image to enlarge
Europe
In Week 35, Europe’s business jet traffic declined 2.8% vs last year, bringing its YTD trend to a sluggish +1.0%, while all top countries saw year-on-year declines last week across Europe. Switzerland declined the least, at -1.8%, followed by the UK at -2.2%, then Italy -2.6%, Germany at -6.6%, finally with France declining 9.2%.
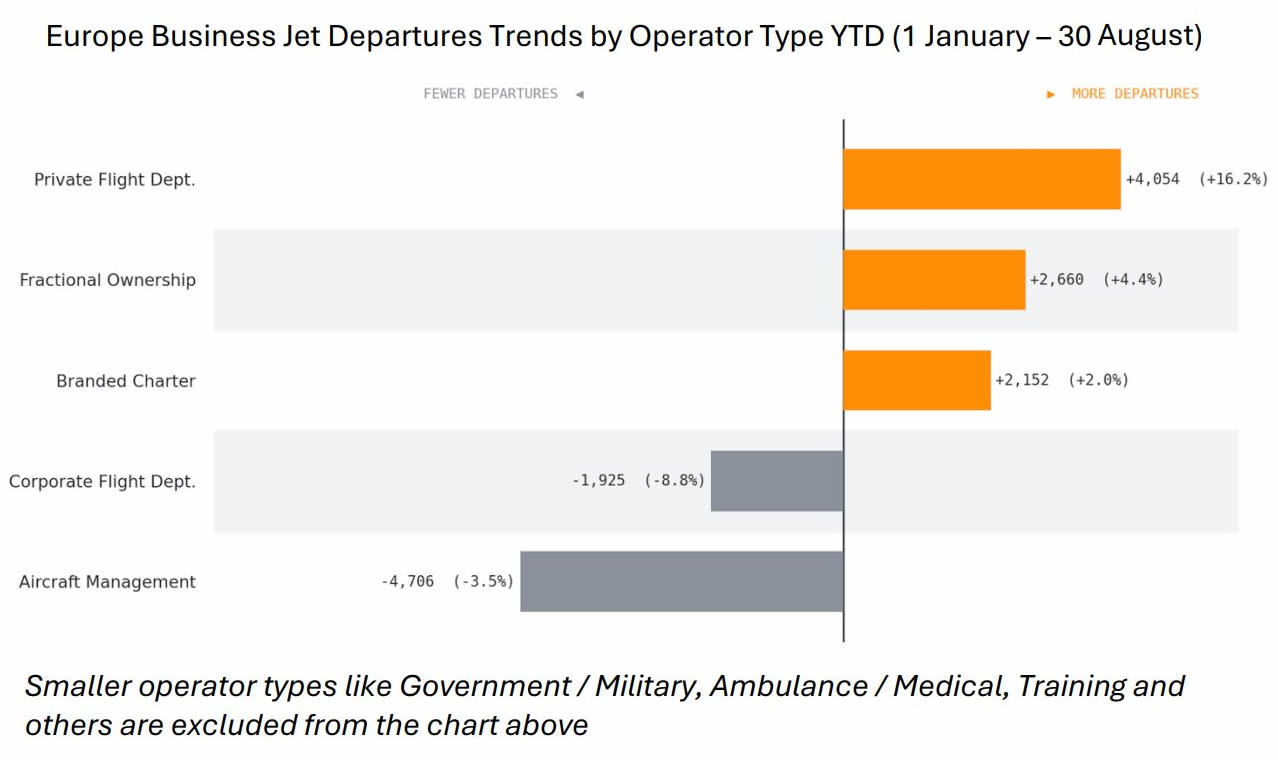
Across the five main operator types that make up roughly 90% of Europe bizjet traffic, departures are just +0.6% year-to-date, compared to the region’s +1.0% overall trend.
Almost all of that growth is driven by Private Flight Departments, which are up 16.2% this year, while Fractional Operators are up 4.4%, although they account for less of the market. The reason the region can’t seem to push up any higher this year is due to its busiest operator type, Aircraft Management, being down 3.5% compared to its traffic last year.
Europe Business Jet Departures Trends by Operator Type YTD (1 January-30 August).
click image to enlarge
Rest of World
Business jet activity in regions outside of Europe and North America expanded 6.5% on a combined basis in Week 35, with growth being driven by South America and Africa, up 21.9% and 18.1%, respectively. In contrast, the Middle East was down 3.7% for a second consecutive week, and Asia was down 7.2%.
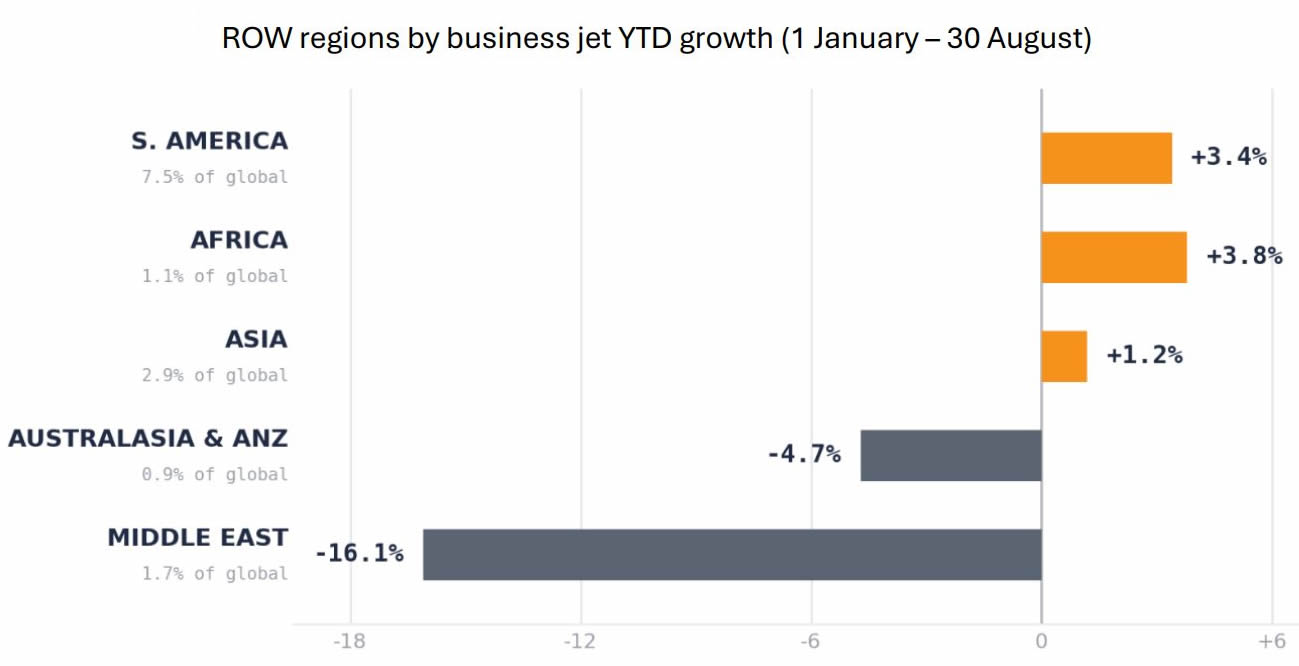
While accounting for 14.0% of global activity, the Rest of World regions are down 0.4% in bizjet activity so far this year compared to last, with growth in Africa and South America offsetting the drop in bizjet demand from the Middle East and Australasia & ANZ. The drop in bizjet demand in the Middle East since the Iran war is the most notable drag on global growth, bizjet flights down 16.1% this year, with the region’s ongoing activity accounting for 1.7% of global bizjet activity.
ROW regions by business jet YTD growth (1 January-30 August).
click image to enlarge
Conclusion
Nick Koscinski, WINGX Analyst, comments, “As we near the end of Q3, bizjets are still up 3.5% despite a sluggish past few weeks.
"While the overall growth trend is up modestly, growth diverges greatly by region, with the Mideast still down double digits, North America up almost 5%, and emerging markets like Africa and South America continuing to provide a boost to the overall trend.”
This bulletin is produced by WINGX, part of the JETNET Group. The JETNET Group is an independent organisation with no commercial affiliation with BlueSky News. All references to products, services, and events in this bulletin are editorial in nature and have not been paid for or sponsored by any third party.



As we near the end of Q3, bizjets are still up 3.5% despite a sluggish past few weeks.
"While the overall growth trend is up modestly, growth diverges greatly by region, with the Mideast still down double digits, North America up almost 5%, and emerging markets like Africa and South America continuing to provide a boost to the overall trend.”
Nick Koscinski
WINGX Analyst.
WINGX GmbH
Lilienstraße 11
20095 Hamburg
Germany.
+49 40 23 96 85 05
BlueSky Business Aviation News | 3rd September 2026 | Issue #856

| © BlueSky Business Aviation News Ltd 2008-2026 |