


WINGX Global Market Tracker:
Global bizjets experience 3 straight weeks of declines for first time since 2024
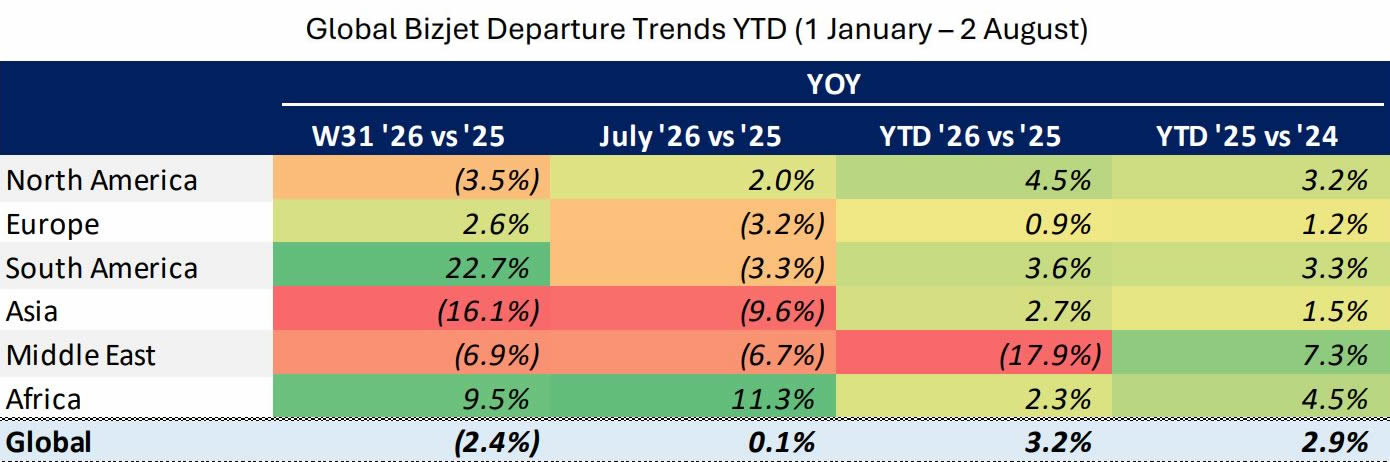
Global bizjet activity contracted yet again in Week 31 (27 July-2 August), down 2.4%, which is the first time since Weeks 39 through 41 of 2024 that global bizjets declined three weeks in a row.
The year-to-date figure now sits at +3.2% ahead of last year through 2 August, which is now only a slight increase compared to the trend for the same dates in 2025 vs 2024, a large shift from the 1.0 percentage point lead seen in previous weeks. South America and Africa were once again the standout regions last week, accounting for a combined 4% share of global traffic, while South America was 22.7% ahead of Week 31 last year, and Africa 9.5% ahead.
In all the regions that saw July YOY declines (Europe, South America, Asia, Middle East), the main driver of the declines was a softness in Part 135 traffic last month. On a combined basis, Part 135 traffic made up 41% of all bizjet flights in Europe, South America, Asia, and the Middle East, while declining 7.9%. Part 91 and 91K traffic were mostly flat in those regions, so there was nothing to offset the weakness in Part 135 activity.
Global Bizjet Departure Trends YTD (1 January-2 August).
click images to enlarge
Global Bizjet Departure Trends YTD (1 January-2 August) by Aircraft Certification.
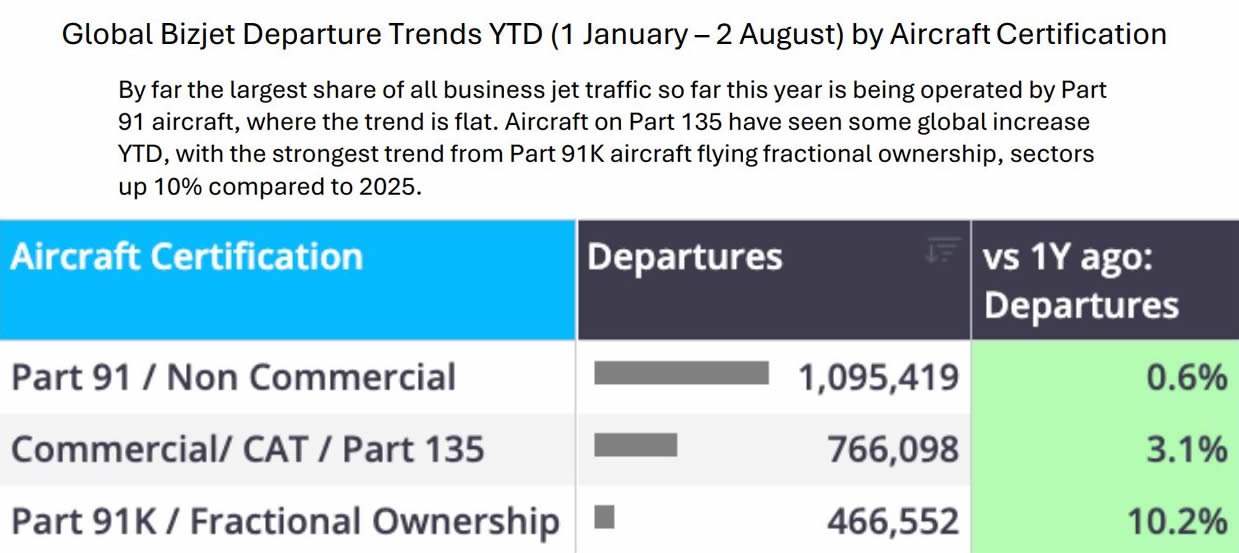
By far the largest share of all business jet traffic so far this year is being operated by Part 91 aircraft, where the trend is flat. Aircraft on Part 135 have seen some global increase YTD, with the strongest trend from Part 91K aircraft flying fractional ownership, sectors up 10% compared to 2025.
Event Analysis: Formula 1 Fills Budapest Apron
*This week’s event analysis examines business jet traffic for the 2026 Hungarian Grand Prix
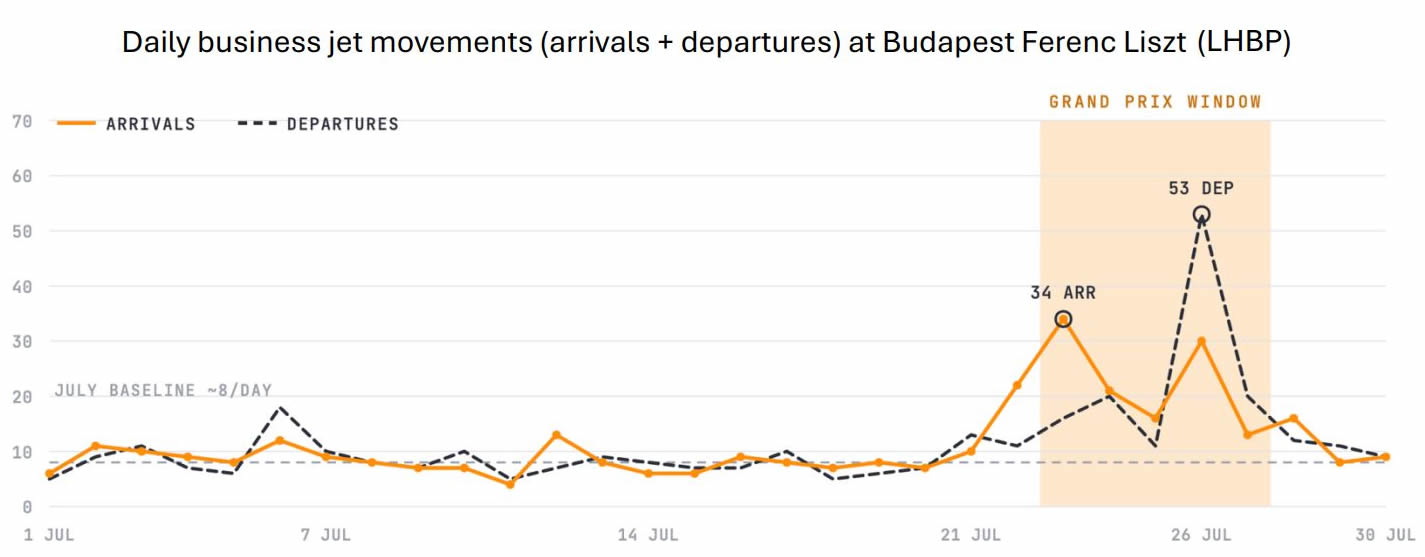
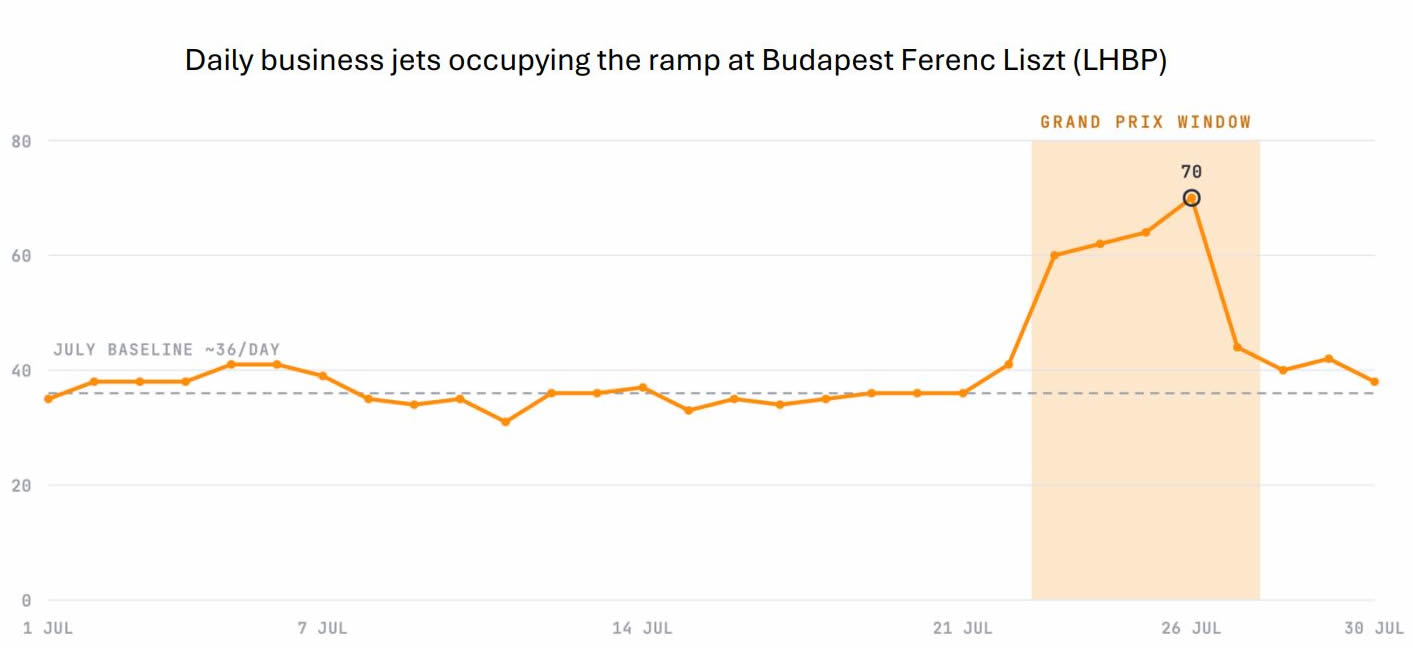
Formula 1’s Hungarian Grand Prix (24-26 July) produced a notable business jet traffic spike into Budapest Ferenc Liszt (LHBP), the metro area’s business jet airport. Traffic built steadily throughout the race week, before the concentrated exodus once the checkered flag fell, following the typical pattern observed at these marquee sporting events.
Some key observations to note:
-
Peak business jets on the ground reached 70 on race day, close to double the ~36 that occupy the apron on a typical July day
-
Race day itself saw 53 departures, which was 13% ahead of last year’s 47 race day departures
-
Inbound traffic was overwhelmingly from European origins: Italy (17% of inbound traffic), France (14%), and the UK (11%) supplied more than 40% of the arriving jets
-
The fleet skewed to short-haul European aircraft segments, with Light and Super Light jets making up 36% of all movements, alongside a notable 18% Ultra Long Range share carrying the longer haul traffic
Daily business jet movements (arrivals + departures) at Budapest Ferenc Liszt (LHBP).
click images to enlarge
Daily business jets occupying the ramp at Budapest Ferenc Liszt (LHBP).
Regional Performance Analysis in Week 31
North America
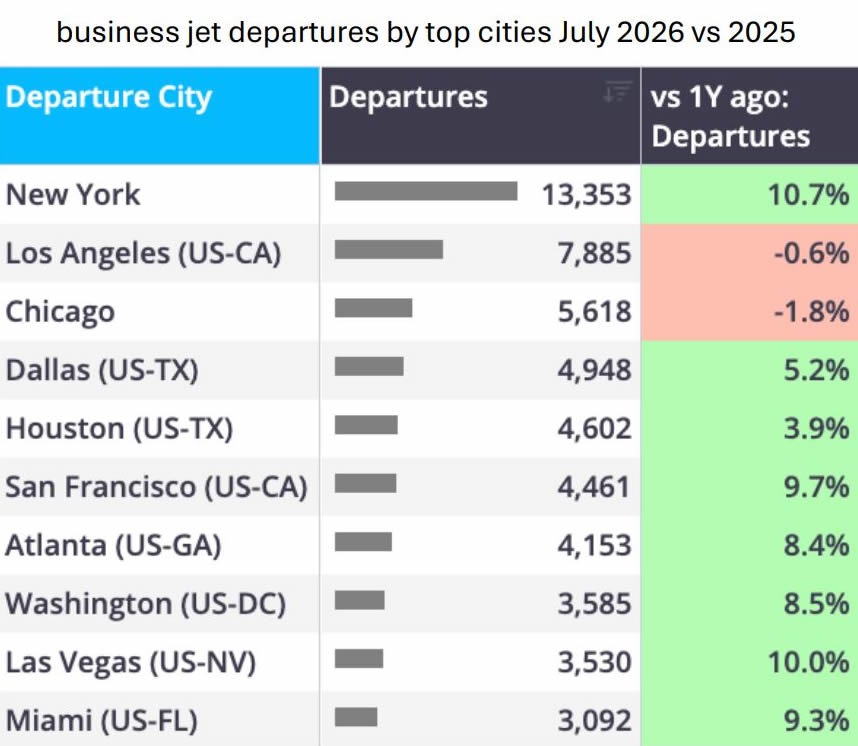
The North American market contracted 3.5% last week year-on-year, with the US matching that trend. Amongst top US states, Texas was the only state to see gains, growing 3.5% compared to Week 31 2025, with California declining 5.3%, and traffic in Florida contracting a notable 13.3%.
US business jet departures by top cities July 2026 vs 2025.
click images to enlarge
Europe
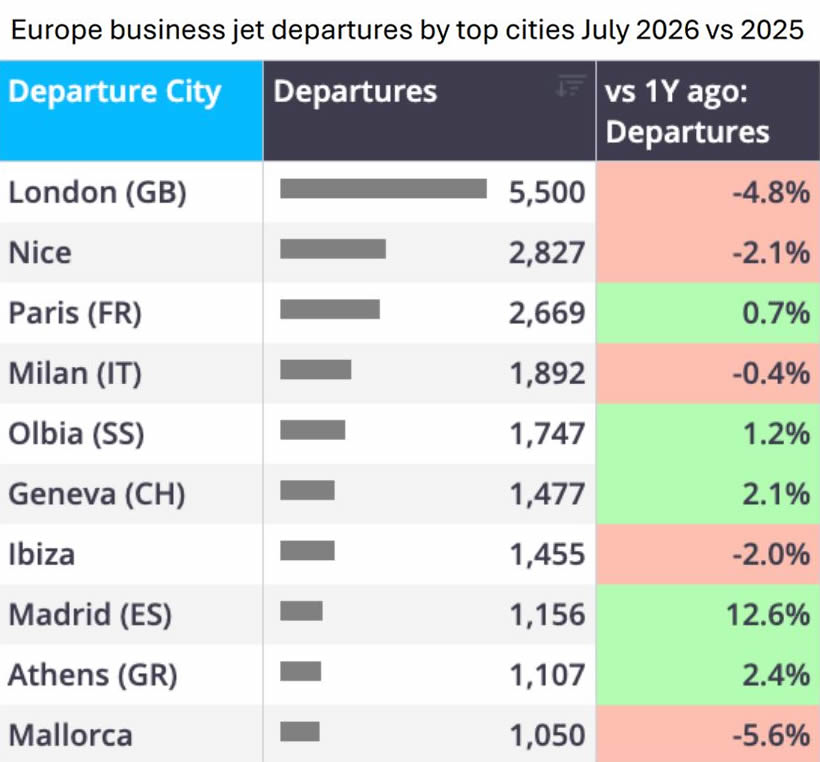
European business jet activity bucked the broader global trend and reversed its consecutive weeks of YOY declines with Week 31 2026 expanding 2.6% compared to Week 31 2025. Week 31 traffic was generally positive from top European countries, with growth led by Italy, 8.9% ahead of last year, followed by Switzerland up 1.7%, then closely behind was the UK up 1.5%, then France expanding just 0.8%, with Germany as the lone country to experience declines, down a significant 15.8%.
Europe business jet departures by top cities July 2026 vs 2025.
click image to enlarge
Rest of World
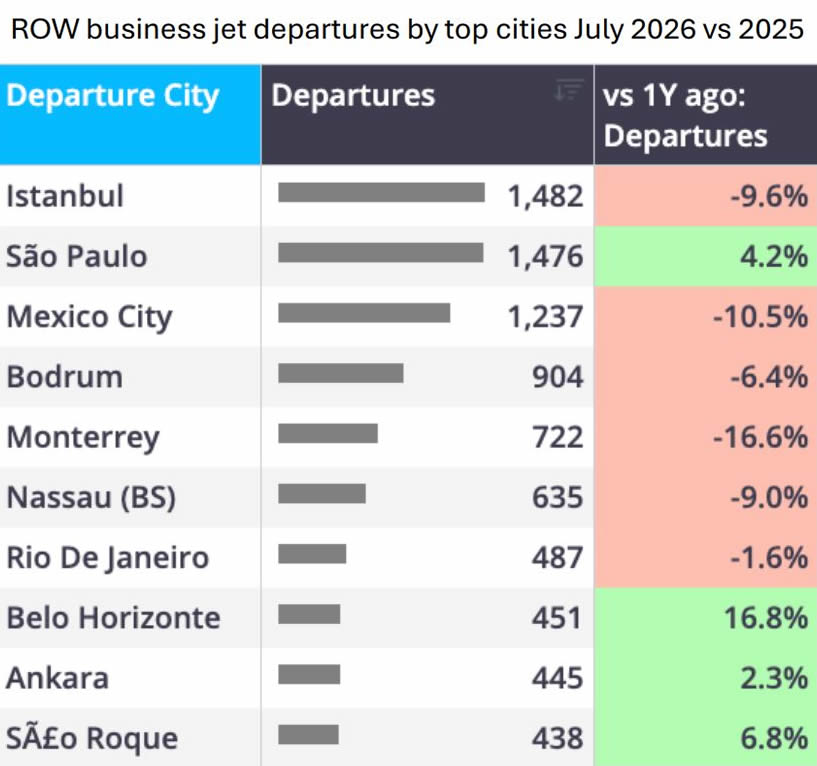
Business jet activity in regions outside of Europe and North America expanded 1.7% on a combined basis, while trends were split by region. South America and Africa were the two ROW regions to realize strong growth, up 22.7% and 9.5%, respectively. On the other hand, the Middle East and Asia struggled, down 6.9% and 16.1%, respectively.
ROW business jet departures by top cities July 2026 vs 2025.
click images to enlarge
Nick Koscinski, WINGX Analyst, comments: "Global business jet activity fell for a third straight week, the first stretch like that since late summer 2024.
"Last week’s weakness came out of North America, Asia, and the Mideast, while South America and Africa kept chugging along. With summer winding down, we’ll be watching for bizjets to pick back up again.”
*For this week’s event analysis, WINGX has provided an evaluation of the 2026 Hungarian Grand Prix using our proprietary AI prompts.
This bulletin is produced by WINGX, part of the JETNET Group. The JETNET Group is an independent organisation with no commercial affiliation with BlueSky News. All references to products, services, and events in this bulletin are editorial in nature and have not been paid for or sponsored by any third party.



"Global business jet activity fell for a third straight week, the first stretch like that since late summer 2024.
"Last week’s weakness came out of North America, Asia, and the Mideast, while South America and Africa kept chugging along. With summer winding down, we’ll be watching for bizjets to pick back up again.”
Nick Koscinski
WINGX Analyst.
WINGX GmbH
Lilienstraße 11
20095 Hamburg
Germany.
+49 40 23 96 85 05
BlueSky Business Aviation News | 6th August 2026 | Issue #854

| © BlueSky Business Aviation News Ltd 2008-2026 |