


WINGX Global Market Tracker:
World Cup saw Host City surge, though overall pace slackening
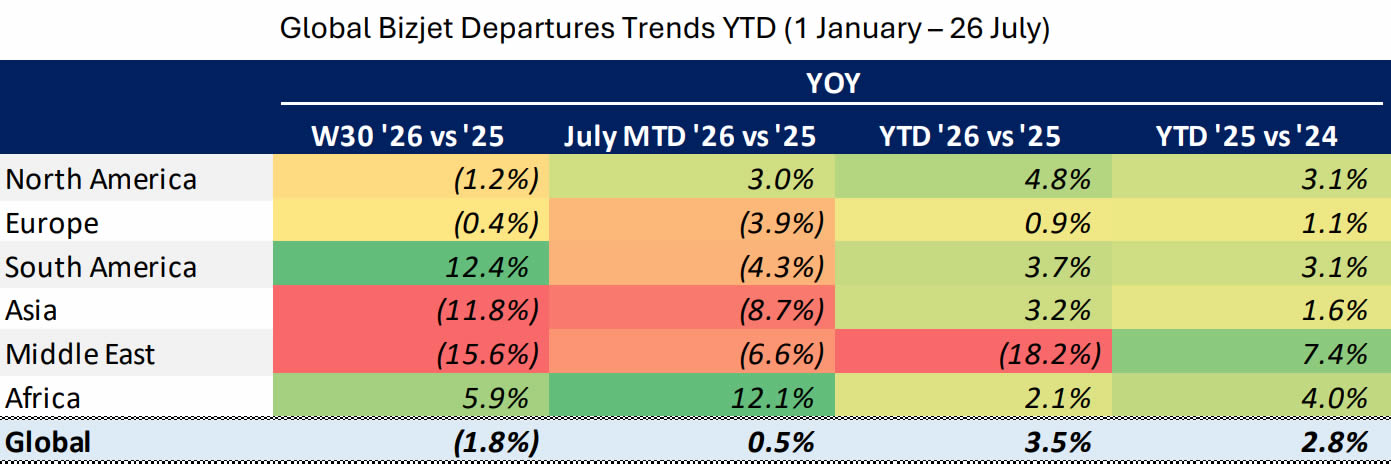
Global bizjet activity contracted 1.8% year-on-year in Week 30 (20-26 July), which marks the second time this year of consecutive weeks with YOY declines (along with Weeks 4 and 5), and the 9th week of YOY declines so far this year.
The year-to-date figure now sits at +3.5% ahead of last year through 26 July, which is a 0.7 percentage point increase compared to the trend for the same dates in 2025 vs 2024.
South America and Africa were the standout regions last week, accounting for a combined 4% share of global traffic, while South America was 12.4% ahead of Week 30 last year, and Africa 5.9% ahead.
Global Bizjet Departures Trends YTD (1 January-26 July).
click images to enlarge
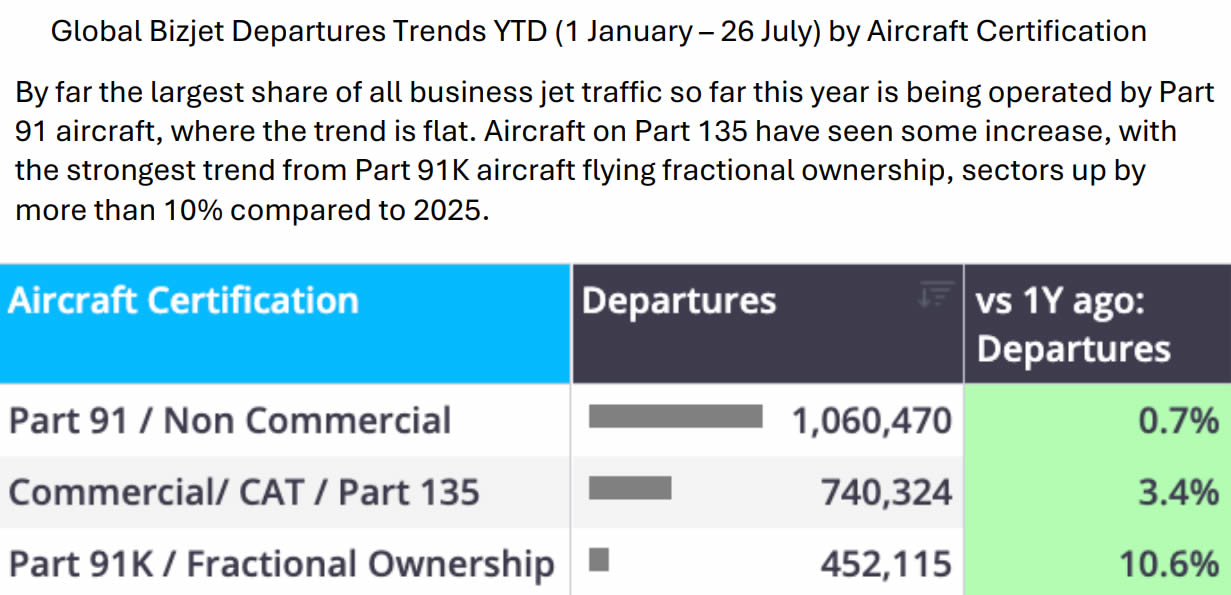
Global Bizjet Departures Trends YTD (1 January-26 July) by Aircraft Certification.
Event Analysis: Knockout rounds drive biggest bizjet surges of the 2026 World Cup
*This week’s event analysis examines business jet traffic for the 2026 World Cup.
Business jet activity into the 16 host metros climbed steadily as the tournament advanced from the group stage towards the final, with the sharpest spikes clustered around the marquee knockout matches and the mornings that followed them.
Some key observations to note:
-
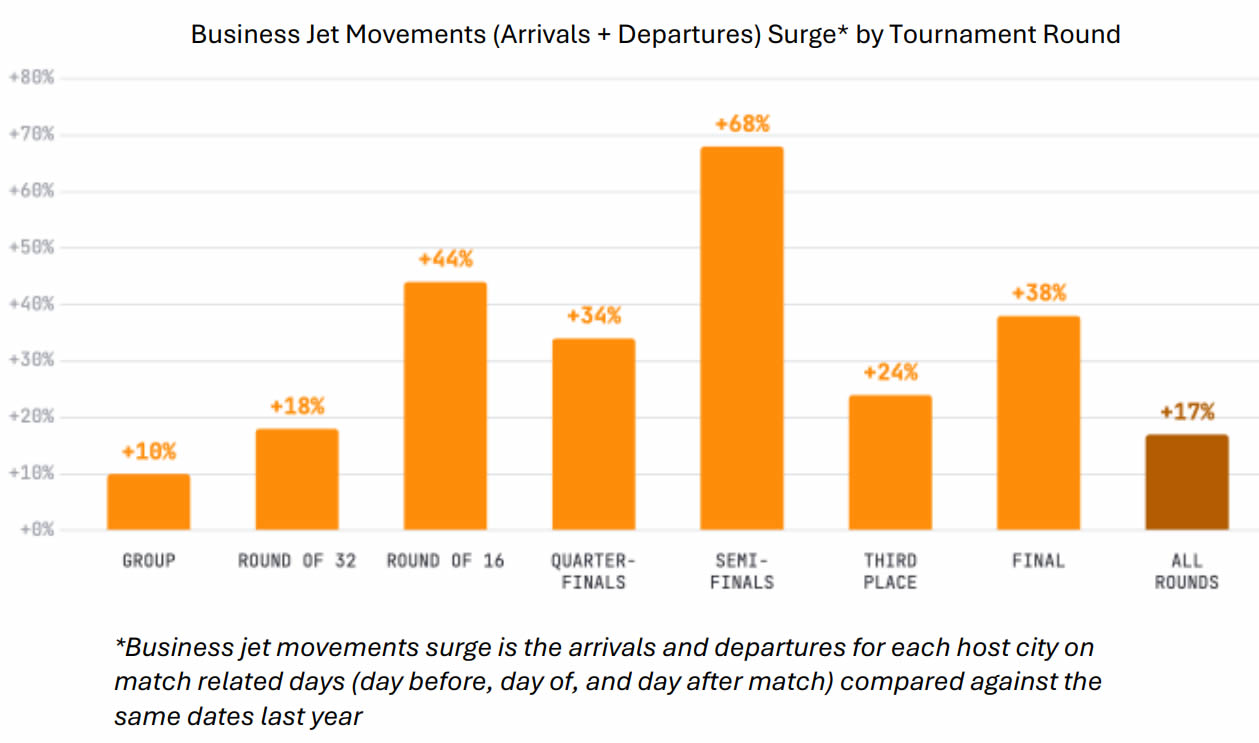
Across all 16 host metros, business jet movements (arrivals + departures) on match related days (day before, day of, and day after match) ran 17% above the same dates a year earlier.
-
The surge built with the tournament progression: +10% in the Group Stage, +44% by the Round of 16, +68% across the two Semi-Finals, with the Final coming in at +38%.
-
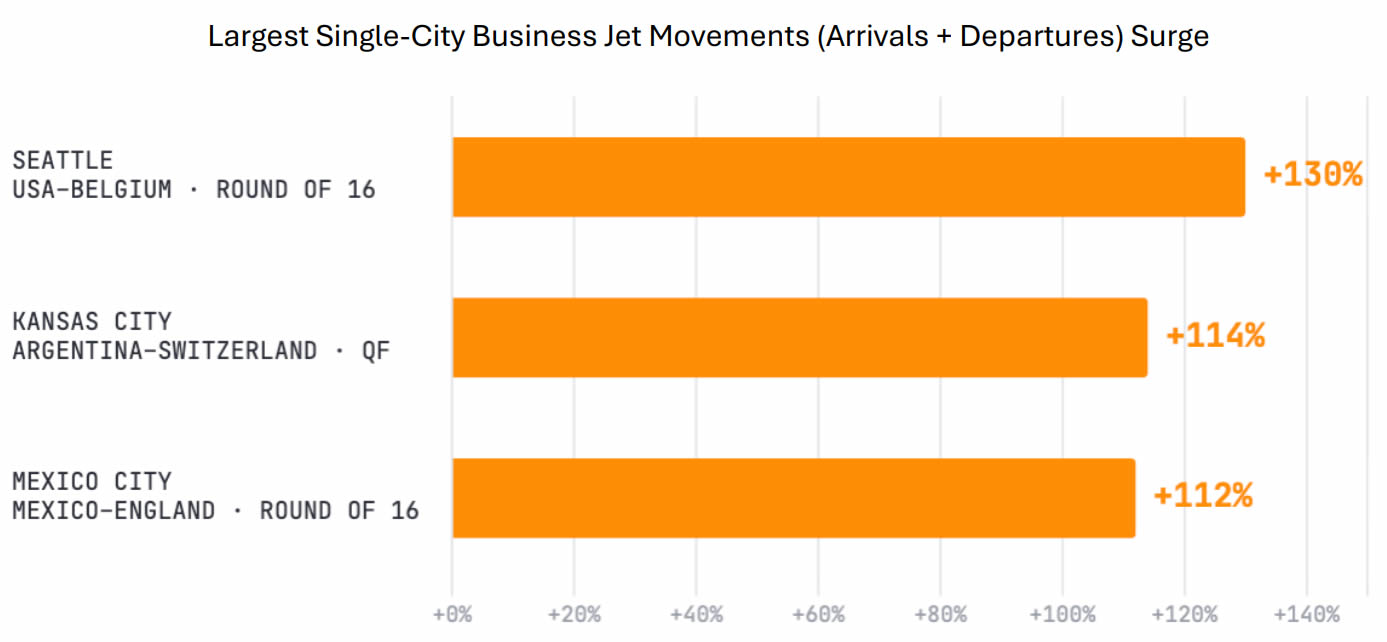
The largest single-city jumps landed on some of the highest profile matches: Seattle rose 130% around the USA – Belgium Round of 16 match, Kansas City jumped 114% for Argentina-Switzerland in the Quarterfinals, and Mexico City spiked 112% for the Mexico-England Round of 16 bout.
Business Jet Movements (Arrivals + Departures) Surge* by Tournament Round.
click images to enlarge
Largest Single-City Business Jet Movements (Arrivals + Departures) Surge.
Regional Performance Analysis in Week 30
North America
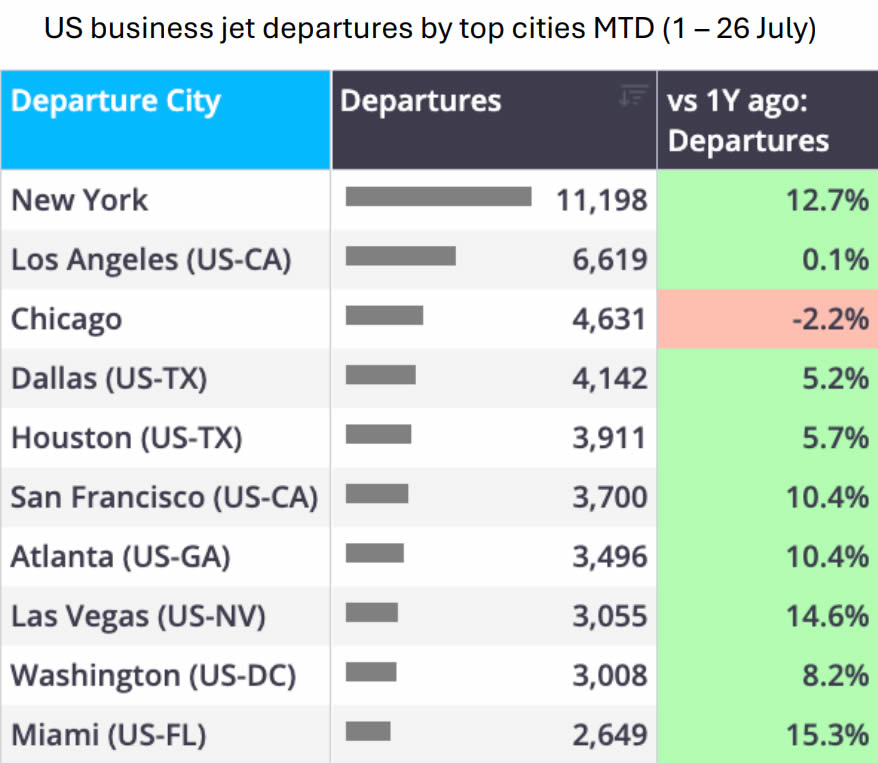
The North American market contracted 1.2% last week year-on-year, with the US following closely at -1.1%. Amongst top US states, Texas was the only State not to decline, though growth was only at 0.4%, with California declining 4.5%, and flight operations out of airports in Florida contracting 6.9%.
US business jet departures by top cities MTD (1-26 July).
click image to enlarge
Europe
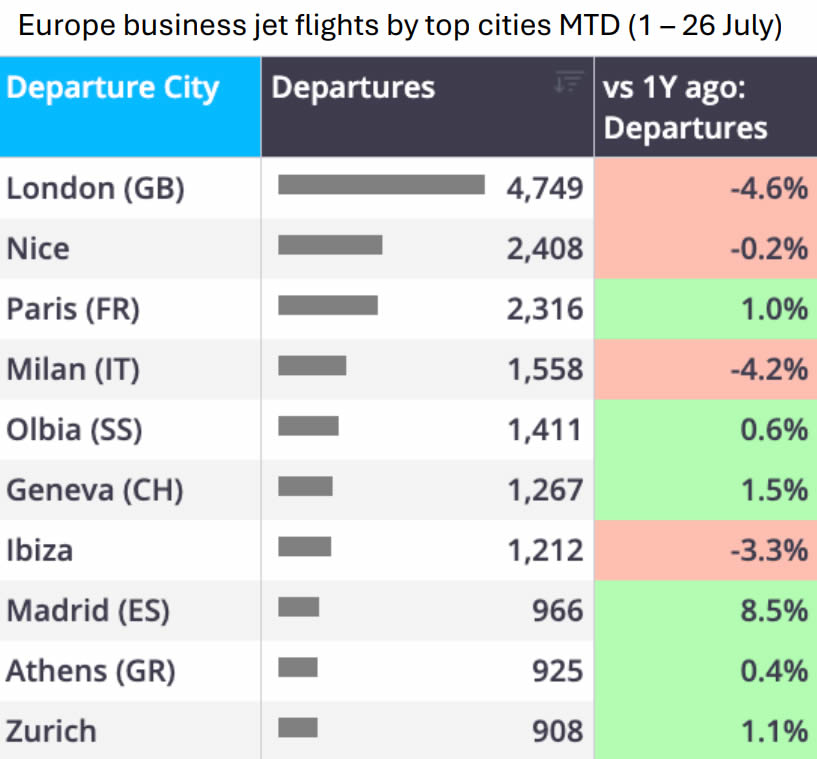
European business jet activity contracted for another consecutive week, the 6th week in a row of weekly YOY declines, with Week 30 down 0.4%. Top European countries saw a mixed bag of growth, with Switzerland leading the growth at an 11.9% increase YOY.
Bizjet flights out of Italy were flat, while the UK was down 0.5%, France down 3.0%, and Germany contracting 14.7%.
Europe business jet flights by top cities MTD (1-26 July).
click image to enlarge
Rest of World
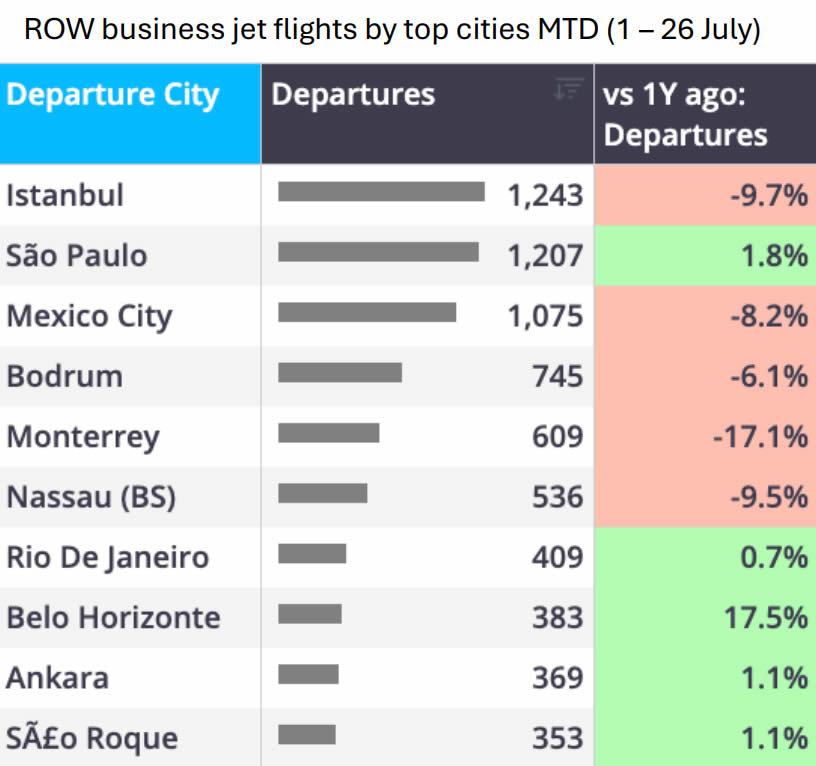
Business jet activity in regions outside of Europe and North America declined 2.8% on a combined basis, while trends were split by region. South America and Africa were the two ROW regions to experience solid growth, up 12.4% and 5.9%, respectively. On the other hand, Asia and the Middle East struggled, down 11.8% and 15.6%, respectively.
ROW business jet flights by top cities MTD (1-26 July).
click image to enlarge
Nick Koscinski, WINGX Analyst, comments: "Week 30 saw another week of year-onyear declines, which is the second time this year we’ve seen consecutive weeks of contractions, although activity is still healthy on a year-to-date basis.
"Just as we thought, the World Cup drew a surge in business jet traffic to the host cities, with the overall tournament drawing a surge of 17%, while the Final alone saw a spike of 38% into NY metro area airports.”
*For this week’s event analysis, WINGX has provided an evaluation of the 2026 World Cup using our proprietary AI prompts.
This bulletin is produced by WINGX, part of the JETNET Group. The JETNET Group is an independent organisation with no commercial affiliation with BlueSky News. All references to products, services, and events in this bulletin are editorial in nature and have not been paid for or sponsored by any third party.



"Week 30 saw another week of year-onyear declines, which is the second time this year we’ve seen consecutive weeks of contractions, although activity is still healthy on a year-to-date basis.
"Just as we thought, the World Cup drew a surge in business jet traffic to the host cities, with the overall tournament drawing a surge of 17%, while the Final alone saw a spike of 38% into NY metro area airports.”
Nick Koscinski
WINGX Analyst.
WINGX GmbH
Lilienstraße 11
20095 Hamburg
Germany.
+49 40 23 96 85 05
BlueSky Business Aviation News | 30th July 2026 | Issue #853

| © BlueSky Business Aviation News Ltd 2008-2026 |