


WINGX Global Market Tracker:
North America powers ahead as Europe stalls and the Middle East sinks
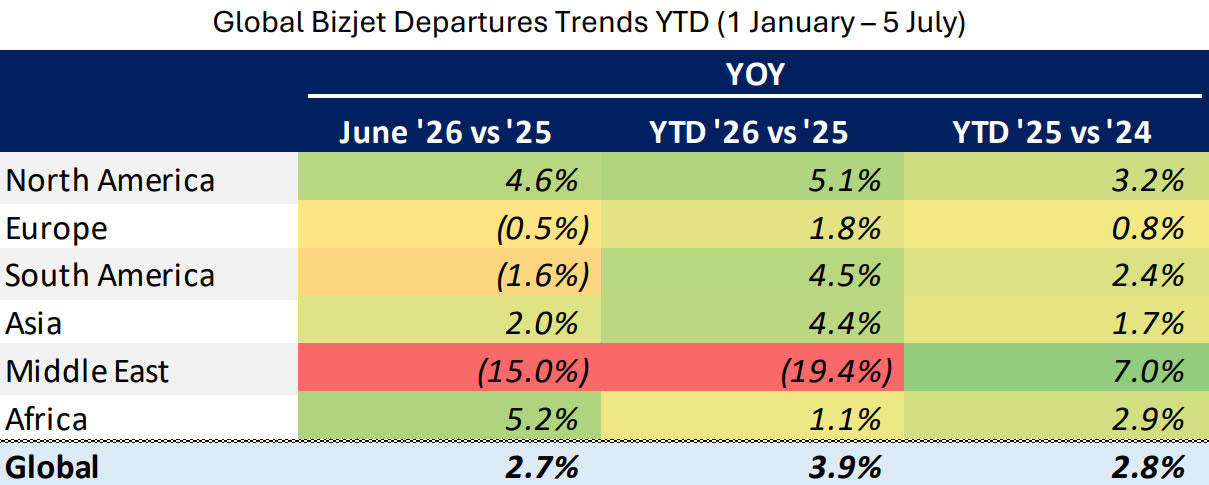
Global bizjet activity expanded 2.7% year-on-year in June, with the year-to-date figure through 5 July at +3.9% ahead of last year, a 1.1 percentage point increase compared to the 2025 vs 2024 trend across the same dates. North America and Africa saw the strongest June gains, at 4.6% and 5.2% respectively.
Global bizjet departures trends YTD (1 January-5 July).
click image to enlarge
Event Analysis: How has the surge in World Cup traffic stacked up thus far?
*This week’s event analysis looks at the World Cup surge in business jet traffic at host
city airports.
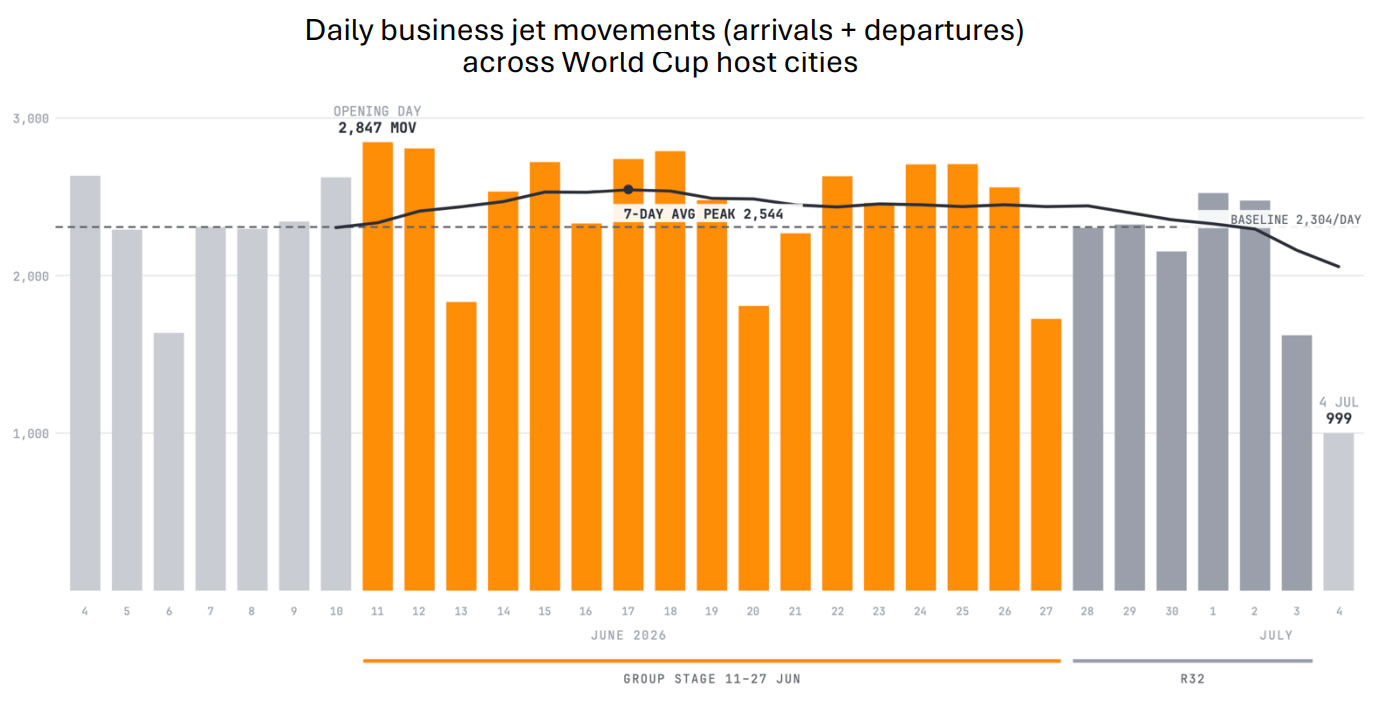
Business jet activity across the 16 World Cup metros averaged 2,467 movements (arrivals + departures) per day during the group stage (11-27 June), which was 7% above the pre-tournament baseline of 2,847 movements, and the 7-day rolling average peaked at 2,544 (+10%) on 17 June as the opening week of fixtures concluded.
The rolling average held a sustained premium through the remainder of the group stage before easing back toward the baseline during the Round of 32. The sharp decline at the end of the series reflects the 4 July holiday (which typically sees a decline in bizjet traffic), when host city activity fell to 999 movements.
Daily business jet movements (arrivals + departures) across World Cup host cities.
click image to enlarge
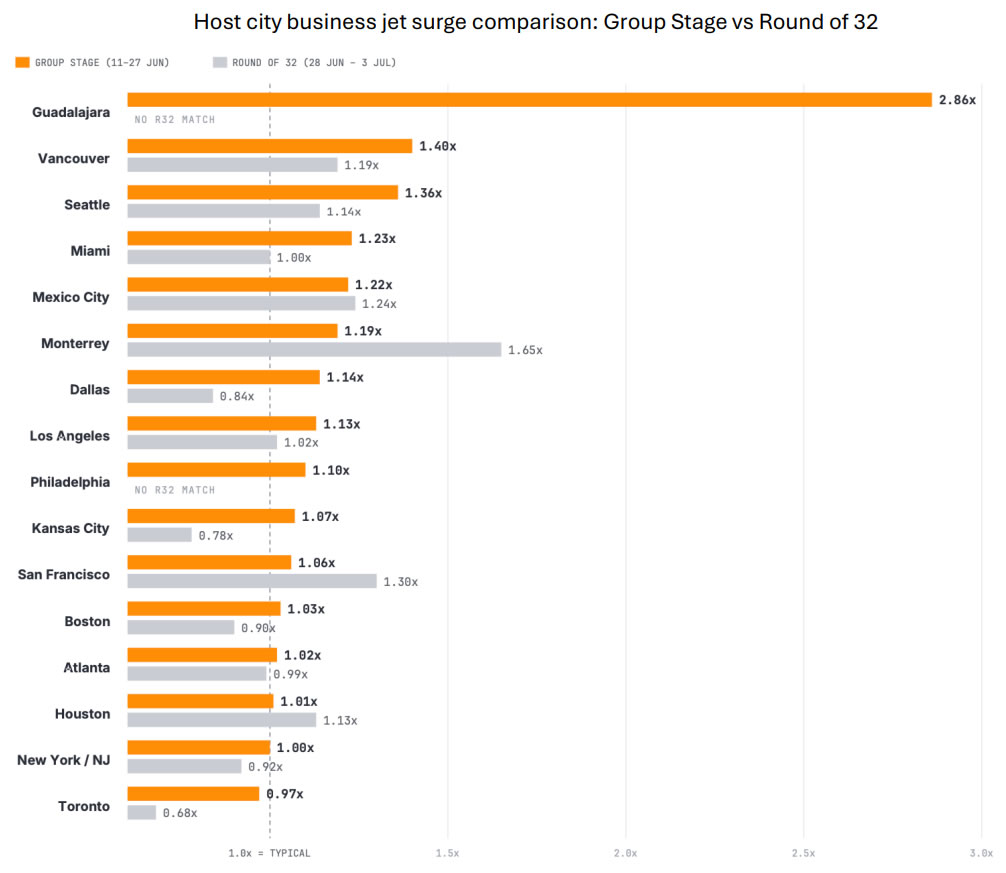
Comparing each host city’s 3-day match windows (day before, day of, and day after match) to its pre-tournament baseline, group stage traffic ran 8% above typical levels, while the Round of 32 was flat overall, partly reflecting the 4 July holiday which fell within the match windows of all three 3 July fixtures.
Guadalajara remained the tournament’s standout at 2.86x its normal traffic, confirming that proportional surges are sharpest in the smallest host markets, while mega-hubs like New York City absorbed five matches with no measurable lift. The knockout round still produced sharp single-city spikes, led by Monterrey at 1.65x following the Netherlands - Morrocco shootout and San Francisco at 1.30x around the USA’s Round of 32 fixture.
Host city business jet surge comparison: Group Stage vs Round of 32.
click image to enlarge
Regional Performance Analysis
North America
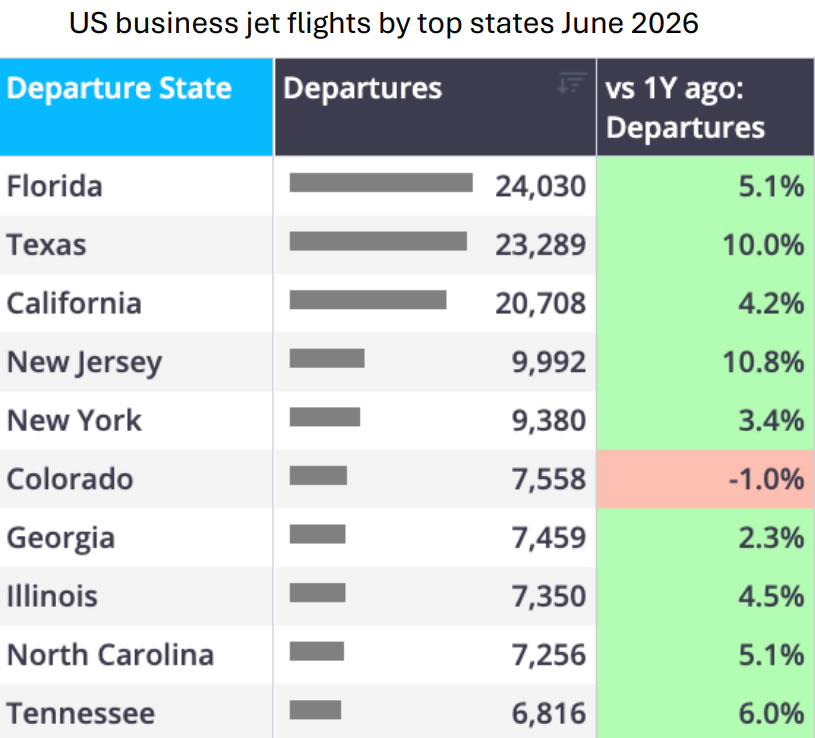
The North American market was one of the strongest markets last month, with bizjets flying 4.6% more than in June 2025, with the US outperforming the region overall, +4.9%. Amongst top US states, June trends were quite strong. New Jersey led growth at 10.8%, followed by Texas’ 10.0% growth, then Florida at 5.1%, California at 4.2%, and New York at 3.4%.
US business jet flights by top states June 2026.
click image to enlarge
Europe
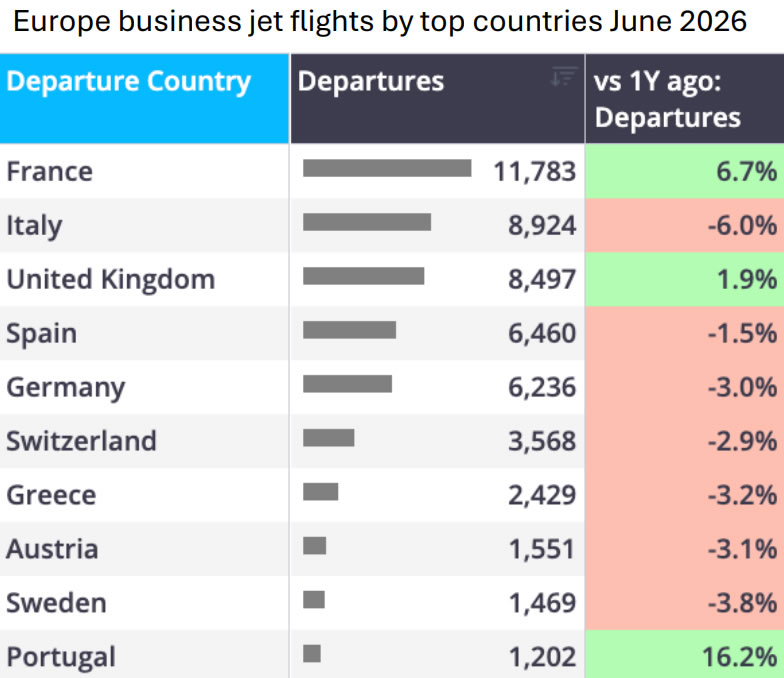
European business jet activity contracted 0.5% for the full month of June, while the region’s top countries saw a variety of growth trends. Portugal led June growth, +16.2%, followed by leading country France with a 6.7% expansion, then the UK with 1.9% growth, while the remaining top countries all realized declines between 1% and 6%.
Europe business jet flights by top countries June 2026.
click image to enlarge
Rest of World
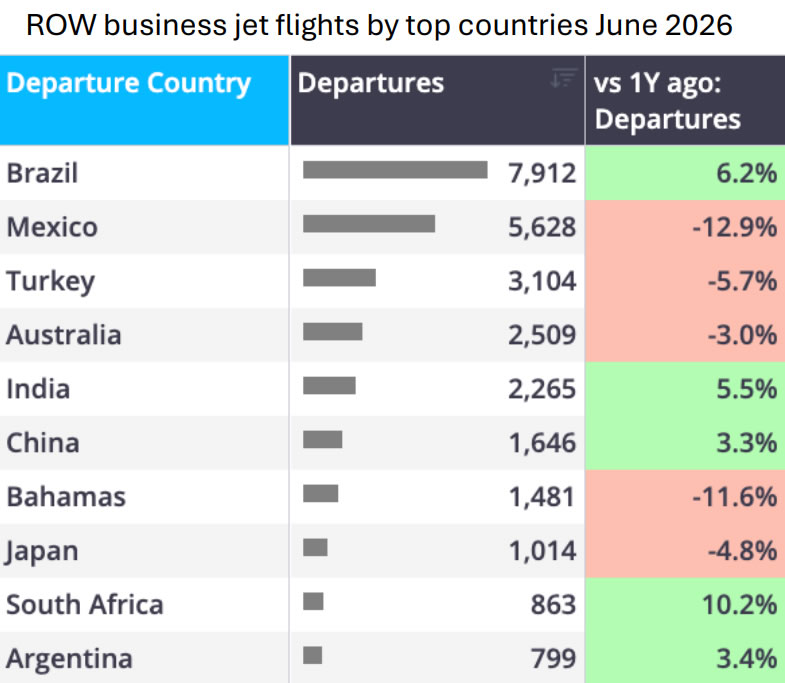
Business jet activity in regions outside Europe and North America declined 2.6% in June on an aggregate basis, primarily due to the Middle East’s 15.0% contraction. Africa led June ROW growth, expanding 5.2% compared to June 2025, followed by Asia’s 2.0% expansion, with South America contracting slightly at 1.6%, finally with the Middle East’s significant 15.0% decline.
ROW business jet flights by top countries June 2026.
click image to enlarge
Nick Koscinski, WINGX Analyst, comments: "At the half-year mark, global bizjet activity is running roughly 4% ahead of 2025, well ahead of last year’s pace at this midway point. The World Cup surge so far is varying based on the size of bizjet market hosting the matches.
"Guadalajara has seen the largest surge amongst all host cities, while mega-hubs like New York are absorbing the traffic with no discernible lift. It will be interesting to see how the surge evolves as the tournament reaches its later knockout rounds.”
*For this week’s event analysis, WINGX has provided a surge analysis for the World Cup
using our proprietary AI prompts.
In collaboration with JETNET, WINGX Managing Director Richard Koe and WINGX Analyst Nick Koscinski have developed the new recurring JETNET iQ Market Monitor report. The report sets out to provide market analysis across all JETNET Group coverage of business jet inventory, market, and flight activity. Please reach out to nick@wingxadvance.com for your copy of the report.
*For this week’s event analysis, WINGX has provided a surge analysis for the Fourth of July weekend using our proprietary AI prompts.
This bulletin is produced by WINGX, part of the JETNET Group. The JETNET Group is an independent organisation with no commercial affiliation with BlueSky News. All references to products, services, and events in this bulletin are editorial in nature and have not been paid for or sponsored by any third party.



"At the half-year mark, global bizjet activity is running roughly 4% ahead of 2025, well ahead of last year’s pace at this midway point. The World Cup surge so far is varying based on the size of bizjet market hosting the matches.
"Guadalajara has seen the largest surge amongst all host cities, while mega-hubs like New York are absorbing the traffic with no discernible lift. It will be interesting to see how the surge evolves as the tournament reaches its later knockout rounds.”
Nick Koscinski
WINGX Analyst.
WINGX GmbH
Lilienstraße 11
20095 Hamburg
Germany.
+49 40 23 96 85 05
BlueSky Business Aviation News | 9th July 2026 | Issue #850

| © BlueSky Business Aviation News Ltd 2008-2026 |