
WINGX Global Market Tracker:
More than 10% growth in US bizjet flights in W2
After a drop-off in January 2026 YOY trends, global bizjet are picking up the pace in Week 2 (5-11 Jan), flights up 9% compared to Week 2 2025, representing a gain of approximately 5,600 bizjet departures.
On a rolling last four-week basis (W51 ‘25-W02 ‘26), global business jet departures are up 4% compared to the same period last year, in line with the trends for the full year 2025 vs 2024. Through the first 11 days of January, business jet activity has set a new record for the strongest start to any year WINGX has tracked.
Highlight of the Week: Google relocation signals broader California exodus
Google announced this week a major corporate restructuring that will relocate significant business entities and assets out of California, marking the latest high-profile departure from the state. The tech giant joins a growing list of companies reevaluating their California presence amid concerns over regulatory environment, tax policies, and operating costs. This corporate migration appears reflected in business aviation data, with California business jet activity showing -2% compared to the first 11 days of 2025.
The first 11 days of the year are also 5% below the start of 2022, which was previously a record setting year with the post-COVID travel boom. The state's traditionally dominant position in business aviation, accounting for approximately 9% of US traffic in 2025 and 11% in 2019, may be shifting as companies increasingly establish operations in lowercost states like Florida and Texas, which have posted 7% and 6% growth respectively for the start of the year.
Regional Performance Analysis
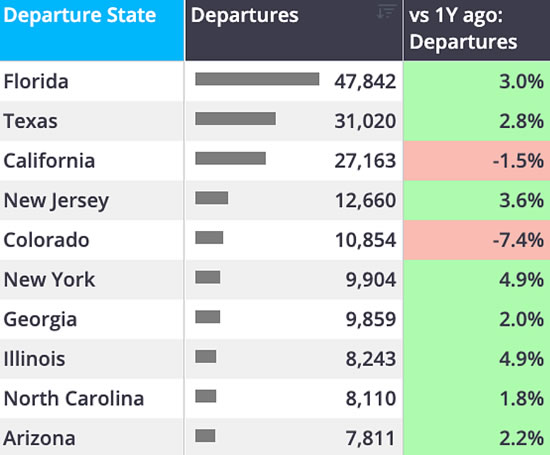
North America: Double-digit 11% growth led by Florida
Business jet activity in the North American market expanded at 11% in W02 2026 yearover-year. On a US State level, Florida was the busiest State, flights up by 11%, next busiest Texas, bizjet flights up by 9%. California saw just 1% increase in flights in W2, while having a 4-week trend of -1% and a 2025 FY trend of +4%. Other fast growing US States in terms of recent YOY bizjet activity include New Jersey, Arizona, and Illinois.
1 December-11 January business jet activity by US state.
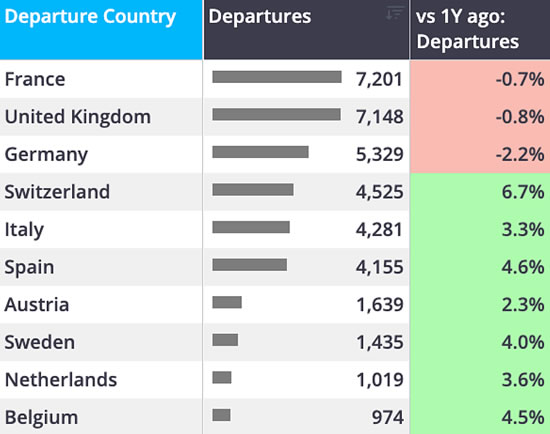
Europe: Flat performance as Germany drops 11%
European business jet flights were flat in Week 2 compared to the same week last year, although there was substantial differentiation across the region. Bizjet departures from Italy saw 7% uptick vs W02 last year; Bizjet arrivals into Switzerland were up 6%; conversely, bizjet traffic in France declined 5%; down by 6% in the UK; and an 11% YOY slump in bizjet traffic in Germany. Europe’s four-week trend (W51 ‘25-W2 ‘26) is up 2% compared to last year, with Italy leading the four-week trend, up 6%, whereas both the UK and Germany are now below the comparable four-week period, -3% and -1% respectively.
1 December-11 January business jet activity by European countries.
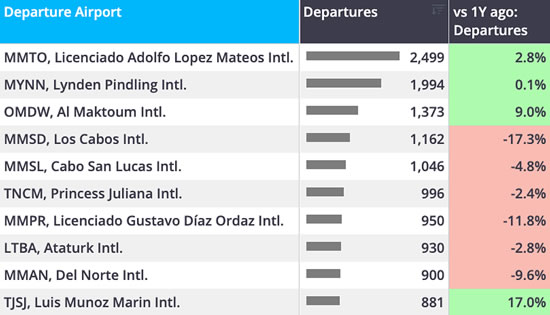
Rest of the World: South America leads with 18% surge
After a slow start to 2026, where ROW bizjet traffic declined 8% YOY in Week 1, activity outside of North America and Europe expanded 6% compared to Week 2 2025. Growth was driven by activity in South America, where bizjets flew 18% more than the
comparable period last year, followed by single-digit growth in Asia and Africa, 4% and 2% respectively. The Middle East was the only ROW region to see a year-over-year decline, down 6%. While the Middle East is now 7% below the comparable four-week
period last year, bizjet demand in South America, Africa, and Asia are sustaining strong trends in the beginning of 2026, with four-week growth trends at 13%, 9%, and 2% respectively.
1 December-11 January business jet activity by ROW airports.
Additional Analysis: Fleet composition reveals distinct operator preferences across manufacturers
WINGX analysis shows a wide disparity in the allocation of OEM business jets by
Operator Type:
-
Private flight departments demonstrate the strongest presence in Cessna fleets at 31%, reflecting the manufacturer's appeal to individual owners.
-
Private flight departments also have a significant representation in Embraer (25%) and Dassault (24%) aircraft.
-
Aircraft management companies show preferences towards Bombardier (39%) and Gulfstream (37%).
-
Corporate flight departments favor premium manufacturers, representing 31% of Dassault fleets and 30% of Cessna operations.
-
Fractional ownership operators concentrate their fleets primarily in Embraer (20%) and Bombardier (12%) aircraft, leveraging these manufacturers' strong positions in the super-midsize and midsize segments.
-
Branded charter operators show balanced presence across all OEMs, ranging from 10% to 14% of fleet composition, demonstrating the diverse aircraft requirements needed to serve varied charter missions and client preferences.
Allocation of OEM fleets* by Operator Type for Full Year 2025.
click image to enlarge

*Shows number of active aircraft, determined by at least one sector flown during the period.


On a rolling last four-week basis (W51 ‘25-W02 ‘26), global business jet departures are up 4% compared to the same period last year, in line with the trends for the full year 2025 vs 2024.
Through the first 11 days of January, business jet activity has set a new record for the strongest start to any year WINGX has tracked.
WINGX GmbH
Lilienstraße 11
20095 Hamburg
Germany.
+49 40 23 96 85 05
BlueSky Business Aviation News | 15th January 2026 | Issue #826

| © BlueSky Business Aviation News Ltd 2008-2026 |