| JETNET has released March 2016 and first quarter 2016 results for the pre-owned business jet, business turboprop, helicopter, and commercial airliner markets.
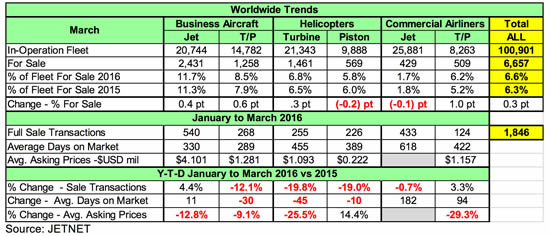
Key worldwide trends across all aircraft market segments, comparing March 2016 to March 2015 reveal that generally, inventories are up, and asking prices are
down.
Business Jets showed the largest increase in the for-sale numbers, with 155 (6.8%) more jets at the end of the first quarter of 2016 compared to 2015. Turbine helicopters increased by 122 (9.1%) and Business Turboprops by 109 (9.5%) in for-sale numbers. Across all aircraft sectors, there were 6,657 (5.4%) more aircraft for sale in the first quarter of 2016 compared to 2015. This is the first increase in the number of business jets for sale since 2009.
Accordingly, Fleet For Sale Percentages for business jets, business turboprops, and commercial turboprops are showing the largest increases of all market sectors in the quarterly comparison, at 11.7% (up .4 pt.), 8.5% (up .6 pt.), and 6.2% (up 1.0 pt.), respectively.
Business Jet retail sale transactions showed a 4.4% increase, and are taking more time to sell (11 days) than last year, with a 12.8% decrease in average asking price. However, Business Turboprops showed a decrease of 12.1% in sale transactions, with a 9.1 % decrease in asking price, and are selling in less time (30 days).
Turbine and Piston Helicopters saw declines in sale transactions in the first quarter comparisons, at 19.8% and 19.0%. They took fewer days to sell, with Turbine Helicopters taking 45 days, and Piston Helicopters 10 days. However, the average asking price for turbine helicopters decreased by 25.5% in the first quarter comparisons.
Among commercial airliners, including the numbers for sale for both commercial jets (including airliners converted to VIP) and commercial turboprop aircraft, Business Jets (at 540) and Commercial Jets (at 433) accounted for 52.7% of the total full sale transactions (1,846).
While pre-owned business jets saw an increase of 23 (4.4%) full sale transactions, new business jet deliveries decreased by 6 business jets (4.7%) - 122 deliveries in the first quarter of 2016 compared to 128 in the first quarter 2015. Meanwhile, NEW turbine helicopter deliveries decreased by 38, 103 (Q1 2016) vs. 141 (Q1 2015), or a drop of 27% in the quarterly comparative periods, as reported by GAMA.
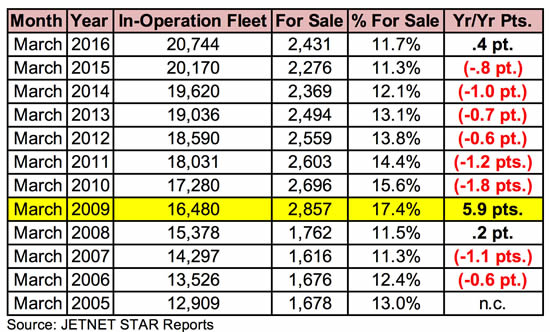
March ending changes from 2005 to 2016 for the business jet in-operation fleet, number for sale, and percentage for sale, show a year-over-year point change (11.7% less 11.3% equals .4 point increase). March 2016 is the first March ending period that the percentage for sale and year-over-year points have increased since March 2009.
In 2009, as the recession struck, there was an explosion of nearly 6% - 1,095 - more business jets listed for sale compared to one year prior. What then followed was a six-year trend toward recovery, as the market steadily shed inventory and moved closer to again being a healthy “seller’s market”. That is, until this year, when the percentage went positive again at nearly half a point, or 155, more business jets listed for sale than in Q1 2015. While this increase is a far cry from the pronounced spike of 2009, Q1 2016 must be regarded as at least a disappointing step backwards for the business jet market.
Pre-owned full retail sale transaction trends
In total, there were 23 (4.4%) more business jet transactions in the first quarter of 2016 than the first quarter of 2015. The results were mixed by aircraft weight class when comparing the first quarters of 2016 and 2015. Two of the weight classes, heavy (35,000+ lbs.) and medium (20,001-35,000 lbs.), showed more transactions, and the other two, light (10,001 -20,000 lbs.) and VLJ (10,000 lbs. or less), showed fewer transactions in the comparative periods.
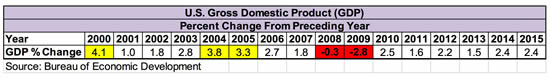
U.S. GDP
From 1950 to 2000, U.S. economic growth as measured by GDP averaged 3.6% annually. But since 2000, GDP growth has been cut by half to 1.7%. Meanwhile, the world economy has been slowing down; its growth in 2015 is estimated to be 3%, and the expected recovery is rather shallow and surrounded by risks.
When the U.S. GDP is 3.0% or higher growth, business aviation does very well. Analysis of the U.S. GDP by year from 2000 to 2015 shows that the years 2000, 2004, and 2005 were the only years that the U.S. GDP growth rate was 3.0% or greater annually. The last two years (2014 and 2015) showed the same growth rate, at 2.4%. The U.S. Federal Reserve estimates a 2016 U.S. GDP growth rate of 2.2%.
Real gross domestic product - the output of goods and services produced by labor and property located in the United States - increased at an annual rate of 0.5% in the first quarter (that is, from the fourth quarter of 2015 to the first quarter of 2016), according to the “advance estimate” released by the Bureau of Economic Analysis (BEA). Accordingly, the first quarter of 2016 is off to a slow start, but the year is young.
For more information on JETNET LLC log on to jetnet.com or contact Michael Chase, 214-226-9882 or
mike@jetnet.com; or contact Paul Cardarelli, JETNET Vice President of Sales, at 800-553-8638 (USA); International inquiries, contact Karim Derbala, JETNET Managing Director of Global Sales, at 41.0.43.243.7056 or
karim@jetnet.com.
|