|
January business aviation flight activity
posted its normal month over month seasonal decline, finishing the period down 1.5% from December; January has
averaged a 1.3% monthly decline, from December, over the past 3 years.
However, reviewing year over year flight activity (January 2016 vs. January 2015), TRAQPak data indicates that January 2016 posted an increase of 3.0%, marking the 11th straight year
over year increase.
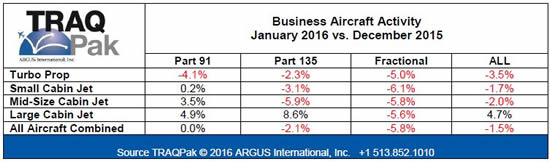
Results by operational category were down or
flat for the month, with Part 91 operators finishing the period up 26 flights from December. The Part 135 market recorded
a monthly drop of 2.1%, while the Fractional market saw a decrease of 5.8%.
Looking at the aircraft categories, the large
cabin market posted the only monthly increase from December, up 4.7%. The small & mid-size cabin markets posted
decreases of 1.7% & 2.0% respectively, while turboprop aircraft posted a drop of 3.5%. The largest monthly gain, for an
individual segment, occurred in the Part 135 large cabin segment, up 8.6% from December.
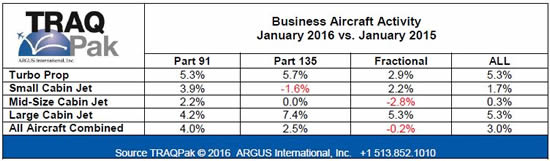
Reviewing year over year flight activity (January 2016 vs. January 2015); TRAQPak data indicates that January 2016
posted an increase of 3.0%, marking the 11th straight year over year increase. The results by operational category saw
continued significant increases in the Part 91 market, which posted an increase of 4.0% overall. The Part 135 market
followed with an increase of 2.5% from January 2015.
The Fractional market was slightly in the red, down 0.2%. Flight
activity by aircraft category was positive across the board, with turboprops & large cabin aircraft leading the way, up 5.3%
respectively. Small & mid-size cabin aircraft posted yearly flight activity gains of 1.7% & 0.3% respectively. The largest
year over year gain for an individual segment occurred in the Part 135 large cabin segment, which saw an increase of
7.4%.
Looking ahead . . .
TRAQPak analysts estimate there will be a 9.1% increase in overall flight activity year over year in February 2016 and projections indicate that Q1 2016 will be up 5.0% from the same
period in 2015.
ARGUS TRAQPak data is serial-number specific aircraft arrival and departure information on all IFR flights in the US
(including Alaska and Hawaii) and Canada. The tables above reflect business aircraft activity data for January 1-31,
2016 vs. December 1-31, 2015 and January 1-31, 2016 vs. January 1-31, 2015 respectively.
A copy of this report can be found at
TRAQPak Business Aircraft Activity
Reports
|